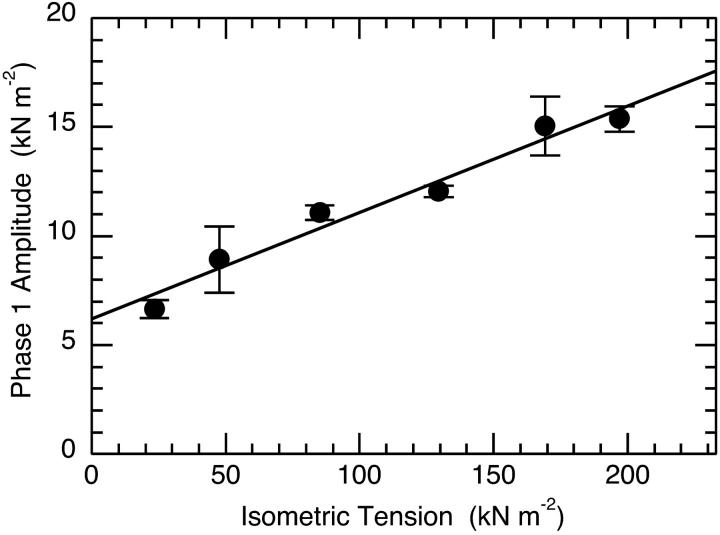
FIGURE 6.
Linear dependence of phase1 stiffness on isometric tension. The plot shows that stiffness increases with temperature. Extrapolation to a limit stiffness at zero tension provides a stiffness of 4.1 kN m−2 nm−1 compared to a limit stiffness at maximum tension (233 kN m−2) of 11.7 kN m−2 nm−1. The temperature dependence of the normalized stiffness of fast rabbit psoas type IIb fibers determined with a −1.5 nm L-jump and the tension versus temperature data obtained from a three-parameter fit to the van't Hoff equation (see Fig. 1 of Davis, 1998) for the fit to the data of Ranatunga, 1994). Tension and stiffness were both determined under identical activating conditions employing the temperature insensitive buffer, glycerol 2-phosphate.

