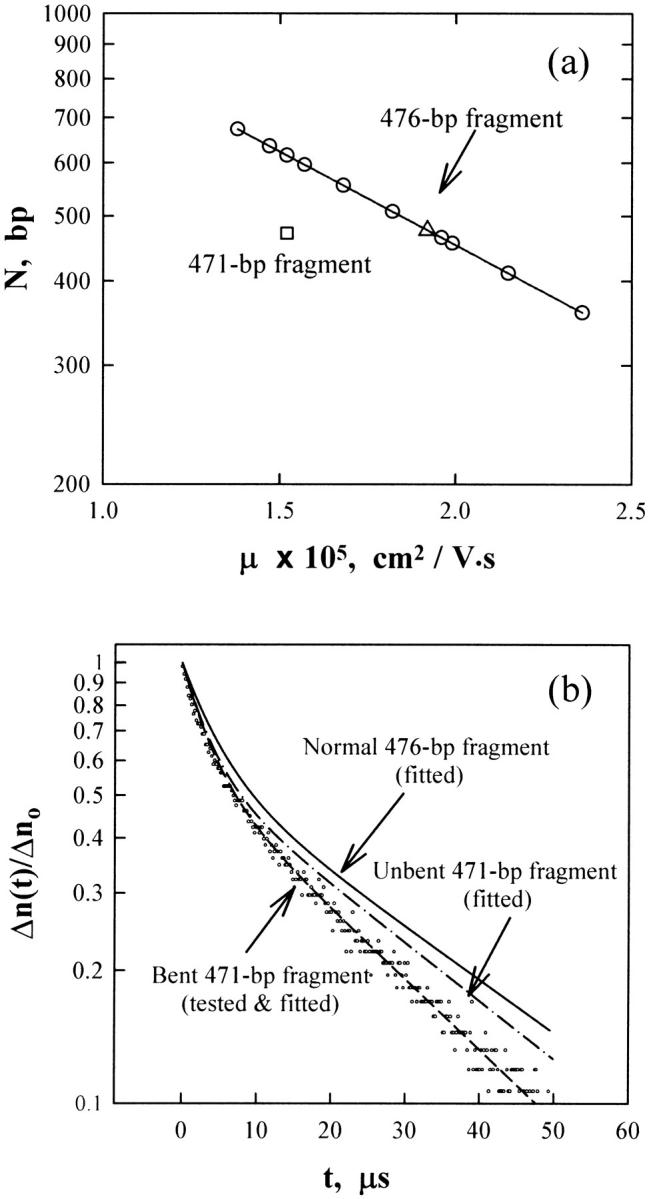
FIGURE 2.

(a) The logarithm of DNA molecular weight, N, in basepairs, as a function of the absolute electrophoretic mobility, μ, observed for the 471-bp fragment (□) and the 476-bp fragment (Δ) in a 6.9% T, 3% C polyacrylamide gel cast and run in 40 mM Tris/1 mM EDTA/39.2 mM MgCl2, pH 8.0 at 23°C using E = 3.33 V/cm. The solid line and circles correspond to the mobilities observed for a standard 50-bp ladder run in the same gel. (b) Semilogarithmic plot of the normalized decay of the birefringence as a function of time. The circles correspond to the measured data for the 471-bp fragment in the buffer (1 mM Tris/0.1 mM EDTA, pH 8.0) at 20°C. The dashed line corresponds to a two-exponential fit of the data points. Only the fitted curve is shown for the 476-bp fragment (solid line) and a normal, unbent 471-bp fragment (dashed-dot line).
