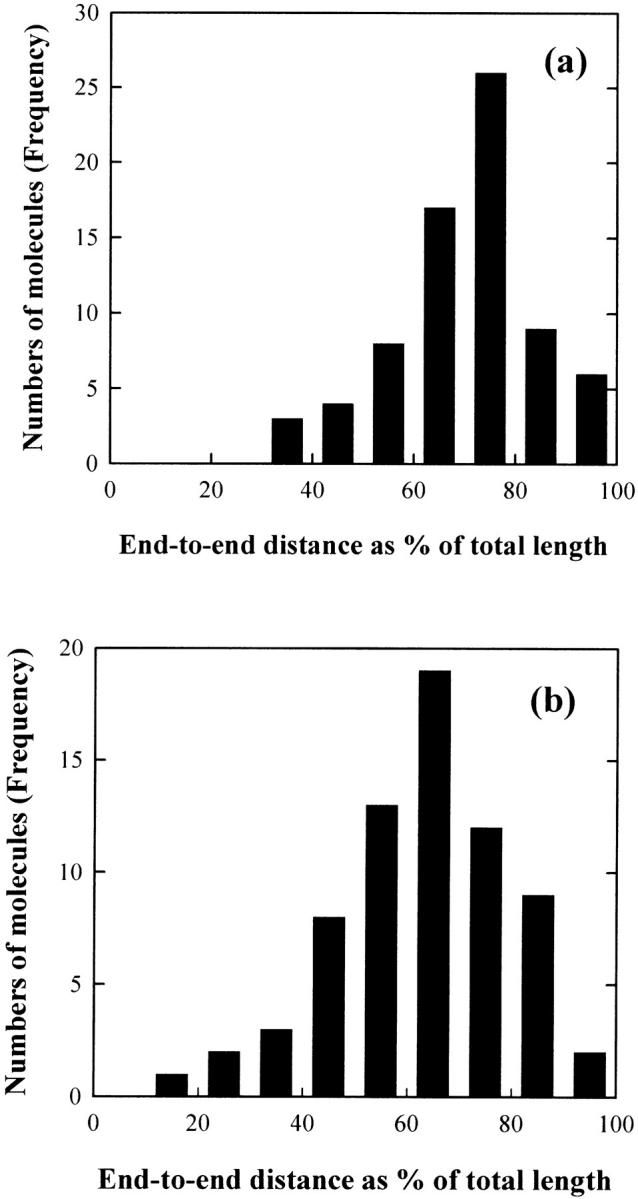
FIGURE 4.

Histograms of the frequency of occurrence of end-to-end distances: (a) for the 476-bp fragment and (b) for the 471-bp fragment. The molecules measured for the analysis were 73 for the 476-bp fragment and 69 for the 471-bp fragment, respectively. The measured mean-square end-to-end distance, 〈R2〉, was converted into the percentage of the average measured contour length of the target DNA.
