
FIGURE 3.
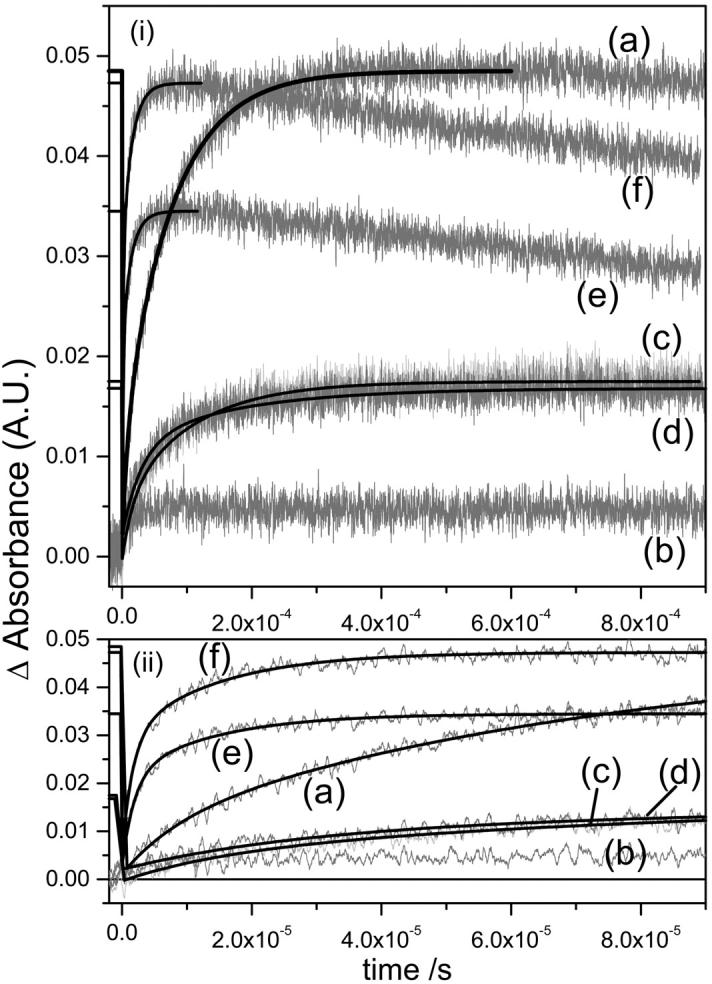
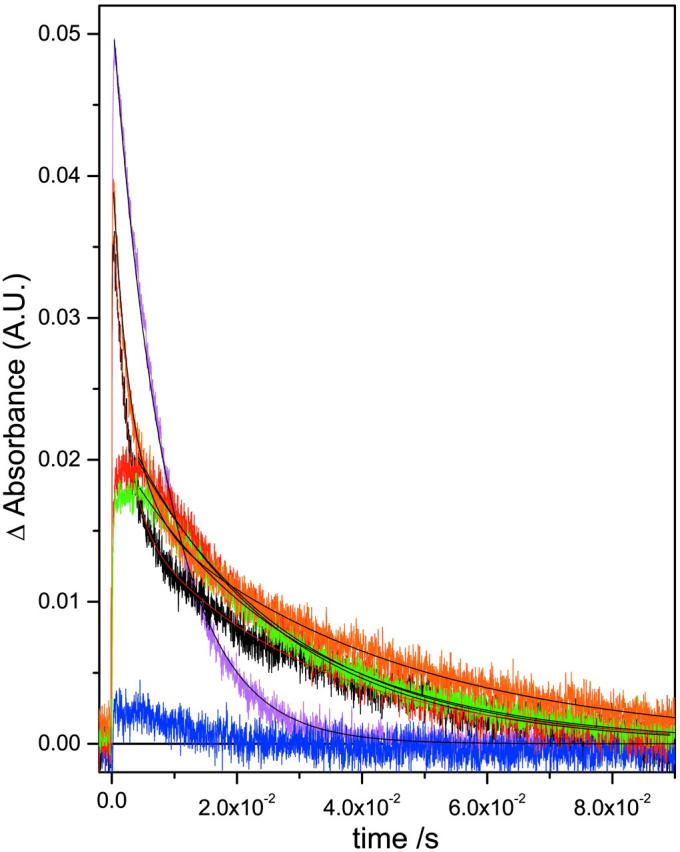
M rise (a) and M decay (b) kinetics for the detergent treated native and deionized bR. For M rise, i displays the whole timescale measured and ii displays the early timescales to aid the reader in comparing the fast component data. The buffers used were sodium acetate for CHAPS (pH 5.5) and Tris for Trition (pH 7.4) as previously described (Szundi and Stoeckenius, 1987; Huang et al., 1980). The legend is: (a) native (magenta), (b) deionized (blue), (c) CHAPS treated native (red), (d) CHAPS treated deI bbR (green), (e) Trition treated native (black), (f) Trition treated deI bbR (orange). Kinetic parameters are shown in Table 2.