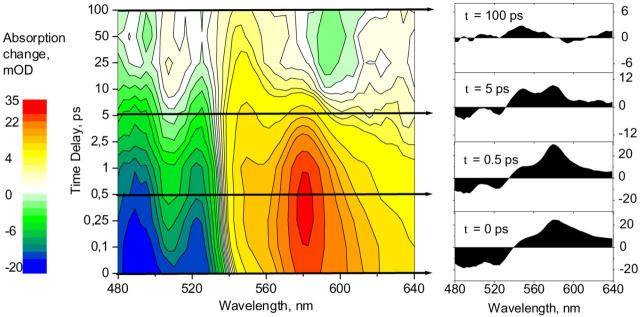
FIGURE 2.
Raw data of transient absorption spectra measurements. Wavelengths have been binned to a 3-nm wavelength resolution with better signal-to-noise. Left, two-dimensional contour plot. Zero absorption change is white, positive yellow/red, and negative green/blue. Right, selected delay cuts. At the earliest time, notice the hotS1 absorption >600 nm. Intermediate cuts clearly show the two separate peaks at 550 and 580 nm. At very long delays, a positive signal at 550 nm survives, identified as triplet T absorption.

