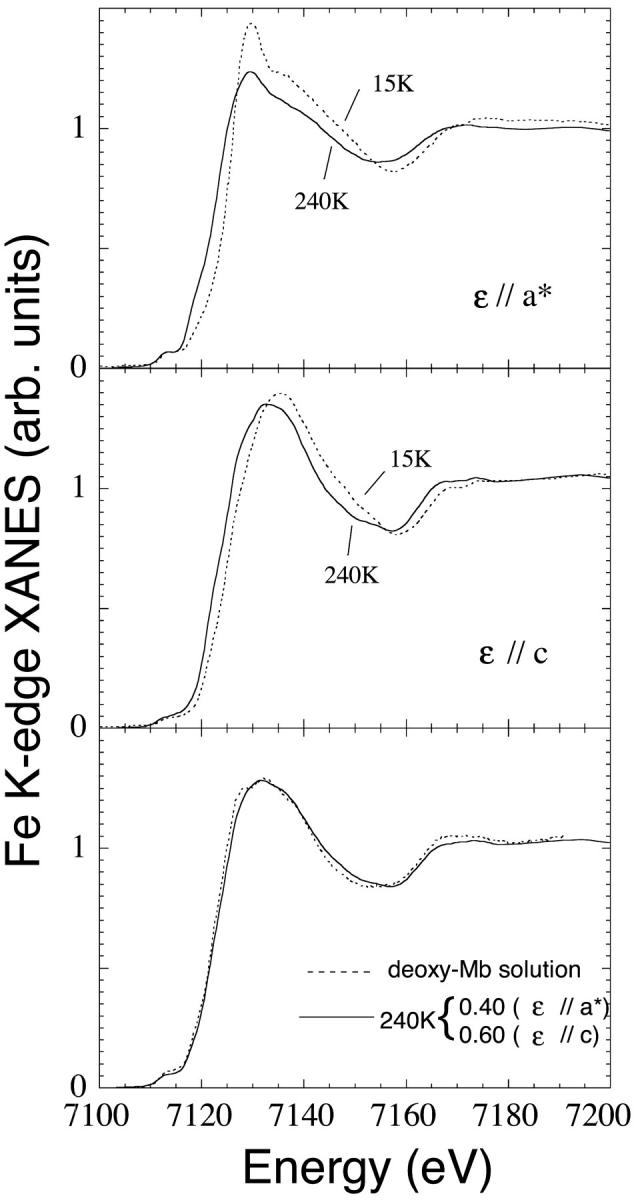
FIGURE 4.

Comparison between the first state Mb(II)H2O at T = 70 K and the final state Mb(II)⋯H2O at T = 240 K of the temperature-dependent dissociation process. (Upper frame) Polarization ɛ//a* along the Fe-water bond. (Middle frame) Polarization ɛ//c on the Fe-heme plane. (Lower frame) Comparison between the spectra of the deoxy-Mb(II) in solution obtained by reduction of met-myoglobin with sodium dithionite (solid curvee) and the Mb(II)—H2O final state of our experiment at T = 240 K in single crystal (dotted curve). This last spectrum is the 0.4/0.6 linear combination of the ɛ//a* and ɛ//c spectra, respectively.
