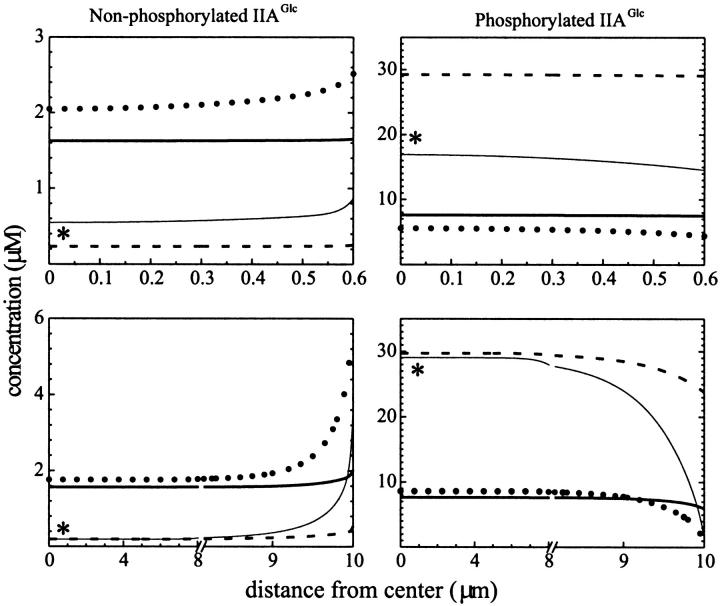
FIGURE 4.
Position dependent response to glucose and free energy. The concentration distribution of nonphosphorylated IIAGlc and phosphorylated IIAGlc in cells with radius 0.6 μm (top) and 10 μm (bottom) under various conditions of metabolite availability; 2800 μM PEP and 0.5 μM glucose (dashed line); 2800 μM PEP and 500 μM glucose (thin solid line, indicated by asterisk); 90 μM PEP and 500 μM glucose (dotted line); and 90 μM PEP and 0.5 μM glucose (thick solid line).

