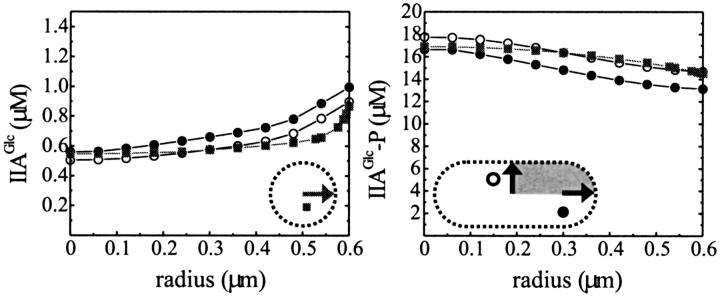
FIGURE 5.
The concentration distribution of nonphosphorylated (left) and phosphorylated IIAGlc (right) in a spherical cell with radius 0.6 μm (squares), and in a rod-like cell with length 3 μm. The distribution in the latter is represented along two lines of length 0.6 μm perpendicular to the membrane boundary. These lines represent the two extremes found in the rod, i.e., through the center of the cylindrical part (open circles) and the spherical part (closed circles), respectively. The arrows in the insets represent the direction of the lines. The metabolite concentrations were as depicted in Table 1.

