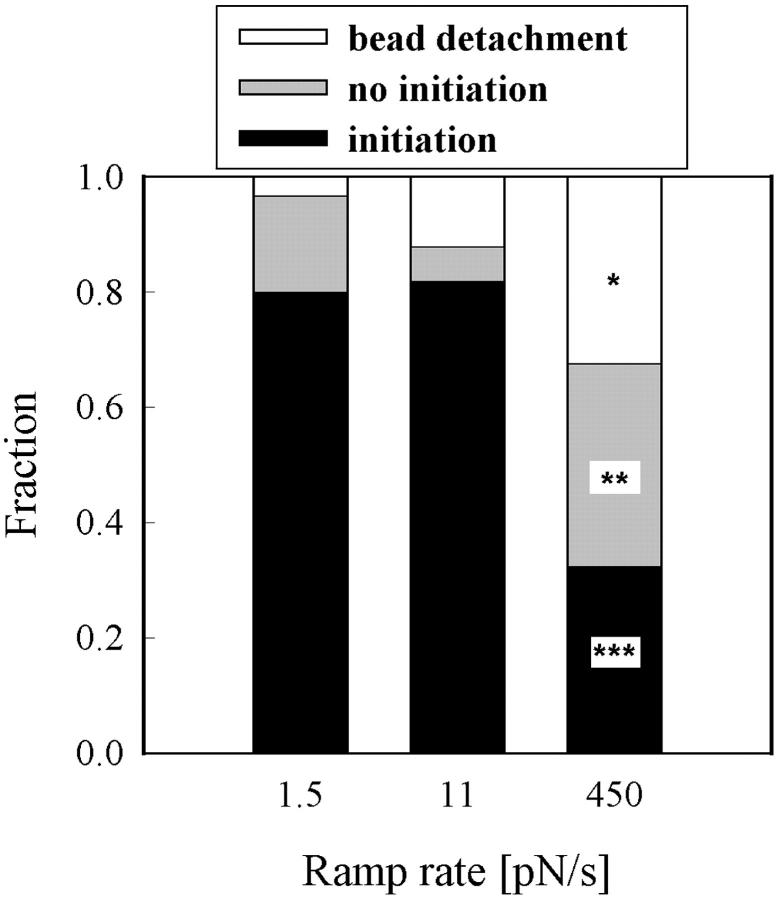
FIGURE 5.
The probabilities of neurite initiation, no initiation, and bead detachment are shown as a function of the initial force ramp rate; ultimate force was 450 pN for all ramp rates. Sample sizes in each category were N = 30 (1.5 pN/s), 33 (11 pN/s), and 37 (450 pN/s). The probabilities of each outcome were not significantly different between the two lower ramp rates, but each was significantly different at 450 pN/s than at the two lower ramp rates (*, p < 0.03; **, p < 0.005; ***, and p < 0.001) as tested by Monte Carlo simulation. Briefly, expected outcome frequencies were calculated by lumping the “control” and “test” data together. Then, two groups of the same size as the original data sets were generated by comparing random numbers to these expected frequencies to simulate outcomes. The simulation of the experiment was repeated 1000 times, and the absolute differences in observed outcome frequencies were ranked among the absolute differences obtained from the simulated data sets to obtain a p-value for each category.

