
FIGURE 9.
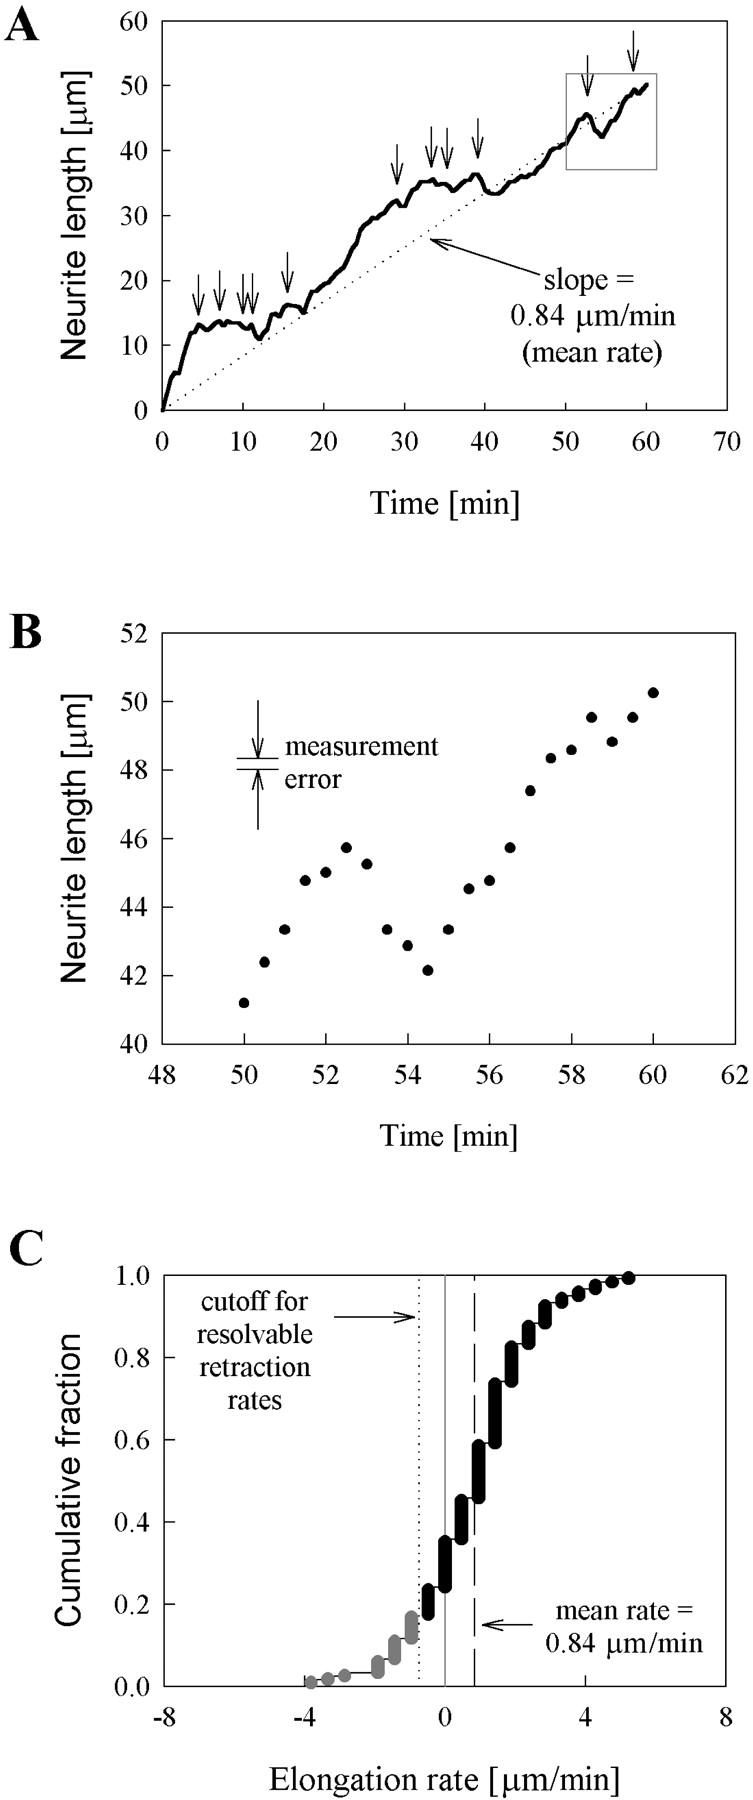
Characterization of short-term neurite elongation rate variability. (A) A single length history (of a neurite initiated and elongated at 220 pN) is shown, with all resolvable retractions indicated by arrows. We considered a negative length change (occurring over one or more 30-s interval) to be a retraction if its value was >0.37 μm (the expected RMS error for a difference measurement between two consecutive lengths, each with an RMS error of 0.26 μm). The mean elongation rate was calculated from the final length and time (equivalently, the slope of the line through the origin and the final point). (B) The region of interest indicated by the box in A is shown, enlarged, along with an indicator of the RMS measurement error (0.26 μm). (C) Rates of length change were calculated from the 30-s interval length data used in A, to calculate the cumulative distribution of instantaneous rates. The cumulative distributions of each of the 29 robust neurites were individually similar in appearance to the distribution plotted in C. Also indicated are the cutoff value for resolvable retractions (i.e., rates <0.37/0.5 μm/min = 0.74 μm/min) and the mean elongation rate for this neurite.