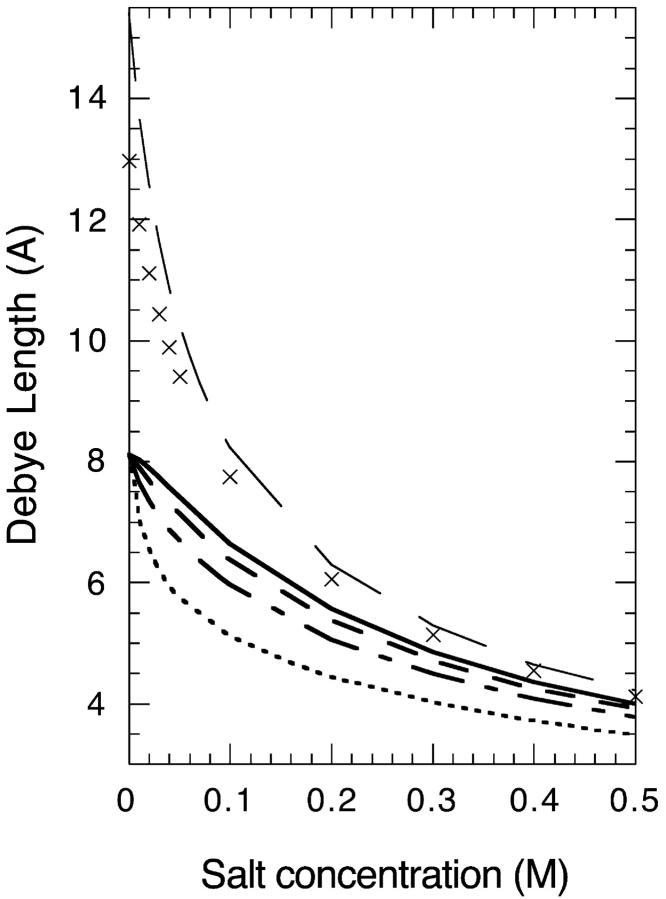
FIGURE 6.
Debye length, for the same model salt solutions as in Fig. 5, as a function of salt concentration in a 5 g/l (M = 14500 g/mol) lysozyme solution. We also show the Debye length at zero protein concentration (long-dashed line), and for comparison the classical (but incorrect) Debye length (crosses). Details are given in the text.

