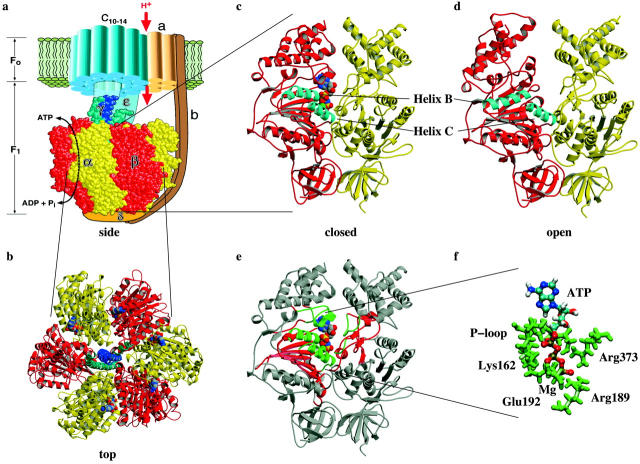
FIGURE 1.
(a) Side view of the F0F1-ATPase. (b) Top view of the F1-ATPase, the β-subunits are colored red, the α-subunits yellow, the γ-shaft blue and cyan. ATP and ADP are shown in space-filling mode. (c) Closed and (d) open configurations of the α/β-subunits. (e) Our setup division of the α/β-subunits, the binding pocket region is colored green, its surrounding red and the outer region gray. (f) The three hydrogen binding regions around ATP in the closed state and the location of Mg. The pictures were created with RASMOL (Sayle and Milnerwhite, 1995), VMD (Humphrey et al., 1996), and MOLSCRIPT (Kraulis, 1991).

