
FIGURE 5.
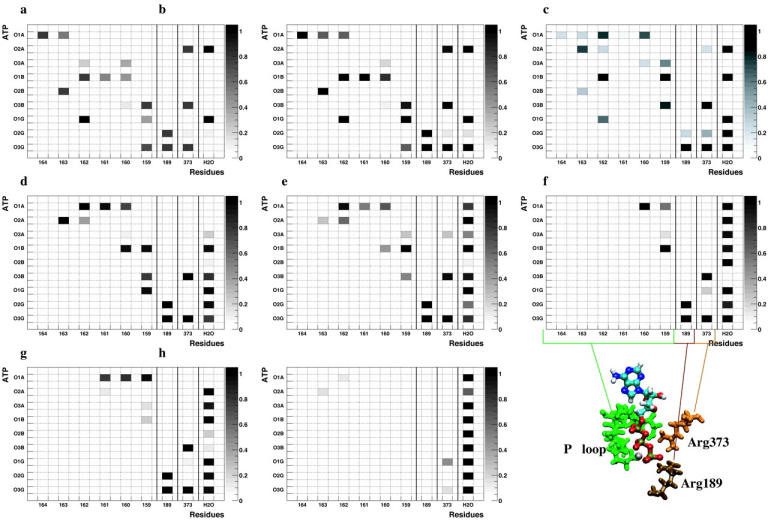
Hydrogen bond populations for every other step, starting at the 2nd step (5 a, top left) and ending at the open state (5 h, bottom right). The data are averaged over the last 1 ns of our equilibration runs and show the fraction of the structures in which the specific hydrogen bond is present. Dark spots correspond to high (i.e., the hydrogen bond is present in all structures) and light spots to low populations. A hydrogen bond was defined to exist if its H-A bond length is shorter than 3.0 Å and its D-H-A angle larger than 120°. The Y axis corresponds to the ATP oxygen atoms, starting with the α-phosphate oxygens at the top and ending with the γ-phosphate oxygens at the bottom. Along the X axis the hydrogen bound residues are shown, starting at β-Val-164 and proceeding along the P-loop to β-Arg-189 and α-Arg-373 (see Fig. 4), the last column shows the hydrogen bonds with the solvent.