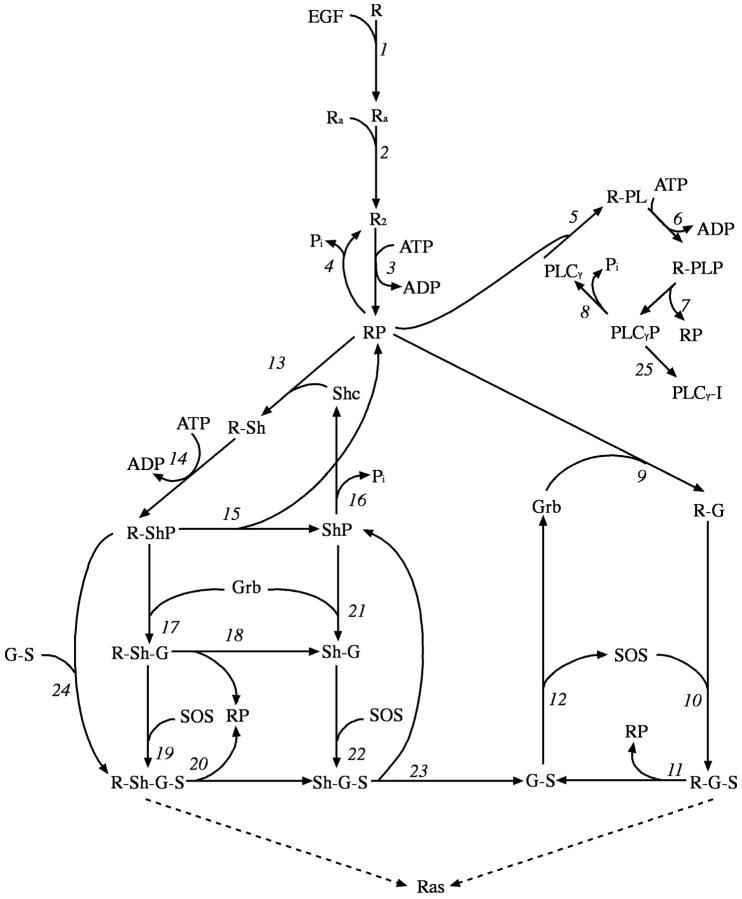
FIGURE 2.
Signal transduction model of the EGF receptor signaling pathway. This figure is adapted from Kholodenko et al. (1999). The rate constants of the reactions 3–25 are tabulated in Table II of Kholodenko et al. (1999). The rates for reactions 1 and 2 are tabulated in Table III.

