
FIGURE 7.
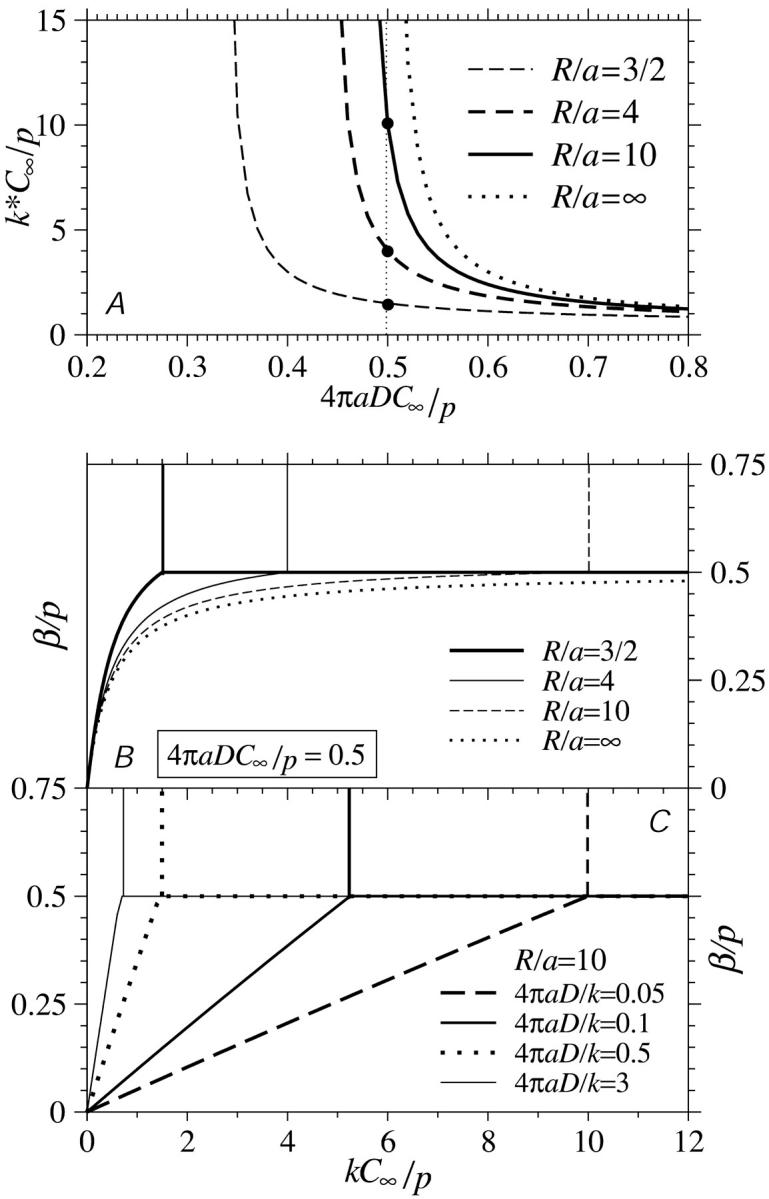
The modified phase diagram for translation rates along long (N → ∞) mRNAs. (A) The minimum binding rate (Eq. 22) required to support the maximal current phase assuming that β > 1/2. This value depends on the bulk ribosome concentration C∞ and the distance R between the initiation and termination sites. (B) The modified phase diagrams as functions of kC∞/p for 4πaDC∞/p = 0.5 and various R/a. (C) Modified phase diagrams as functions of kC∞/p for fixed  and R/a = 10.