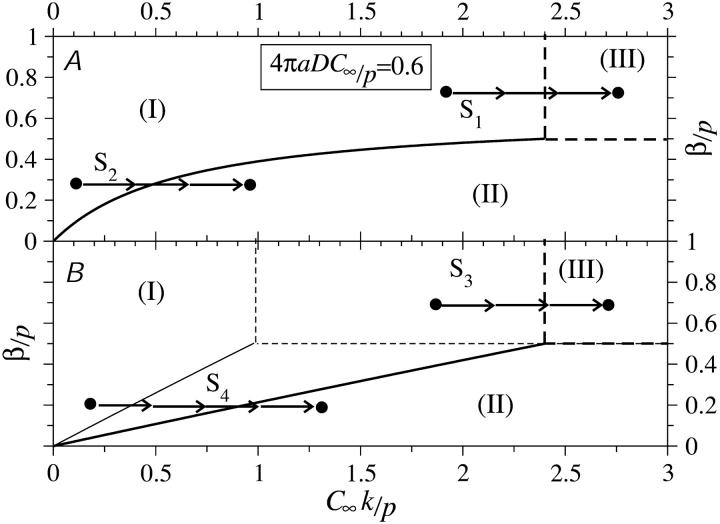
FIGURE 8.
Large N phase diagrams for R/a = 10. (A) Phase diagram for fixed 4πaDC∞/p = 0.6 with trajectories S1,2 corresponding to increasing kinetic “on” rate k. (B) Phase diagram when  is fixed, and trajectories S3,4 correspond to increasing bulk ribosome concentration C∞. Trajectory S3 traverses the I–III phase boundaries for
  (thick curves) but not for
  (thin curves). Trajectory S4, on the other hand, traverses the I–II phase boundaries for both

