
FIGURE 9.
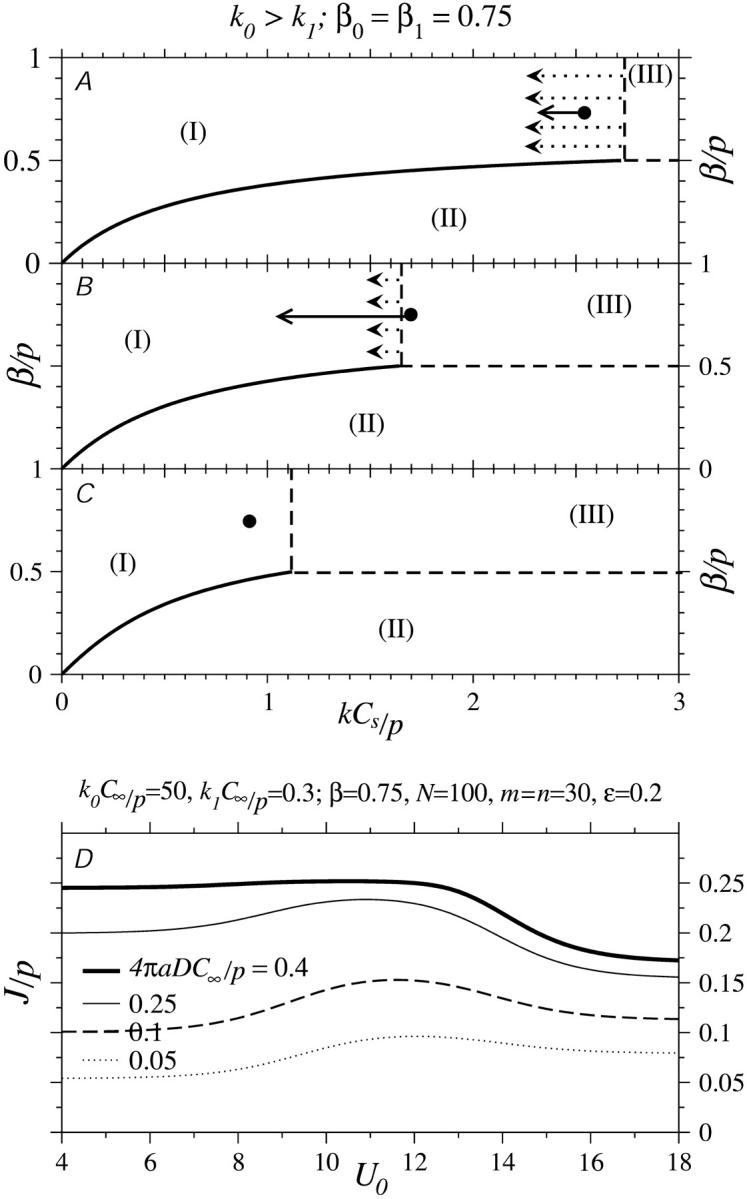
The current (Eq. 1) as a function of U0 when the ribosome “on” rate k can be modified by direct interactions with elongation factor and PAB proteins. The Gaussian chain approximation is used with persistence length ℓ = a. A–C show hypothetical, qualitative trajectories in the presence of a changing phase diagram. As U0 is increased, R decreases. With 4πaDC∞/p = 0.6 fixed, the phase boundaries shown in A–C correspond to R/a = 25,3,3/2, respectively. In addition, if k0 > k1, the effective binding rate keffC∞/p also decreases with increasing U0, resulting in the trajectories indicated by the dot. (D) Currents for k0C∞/p = 50, k1C∞/p = 0.3, and N = 100. The weak maximum appears only for small 4πaDC∞/p.