
FIGURE 9.
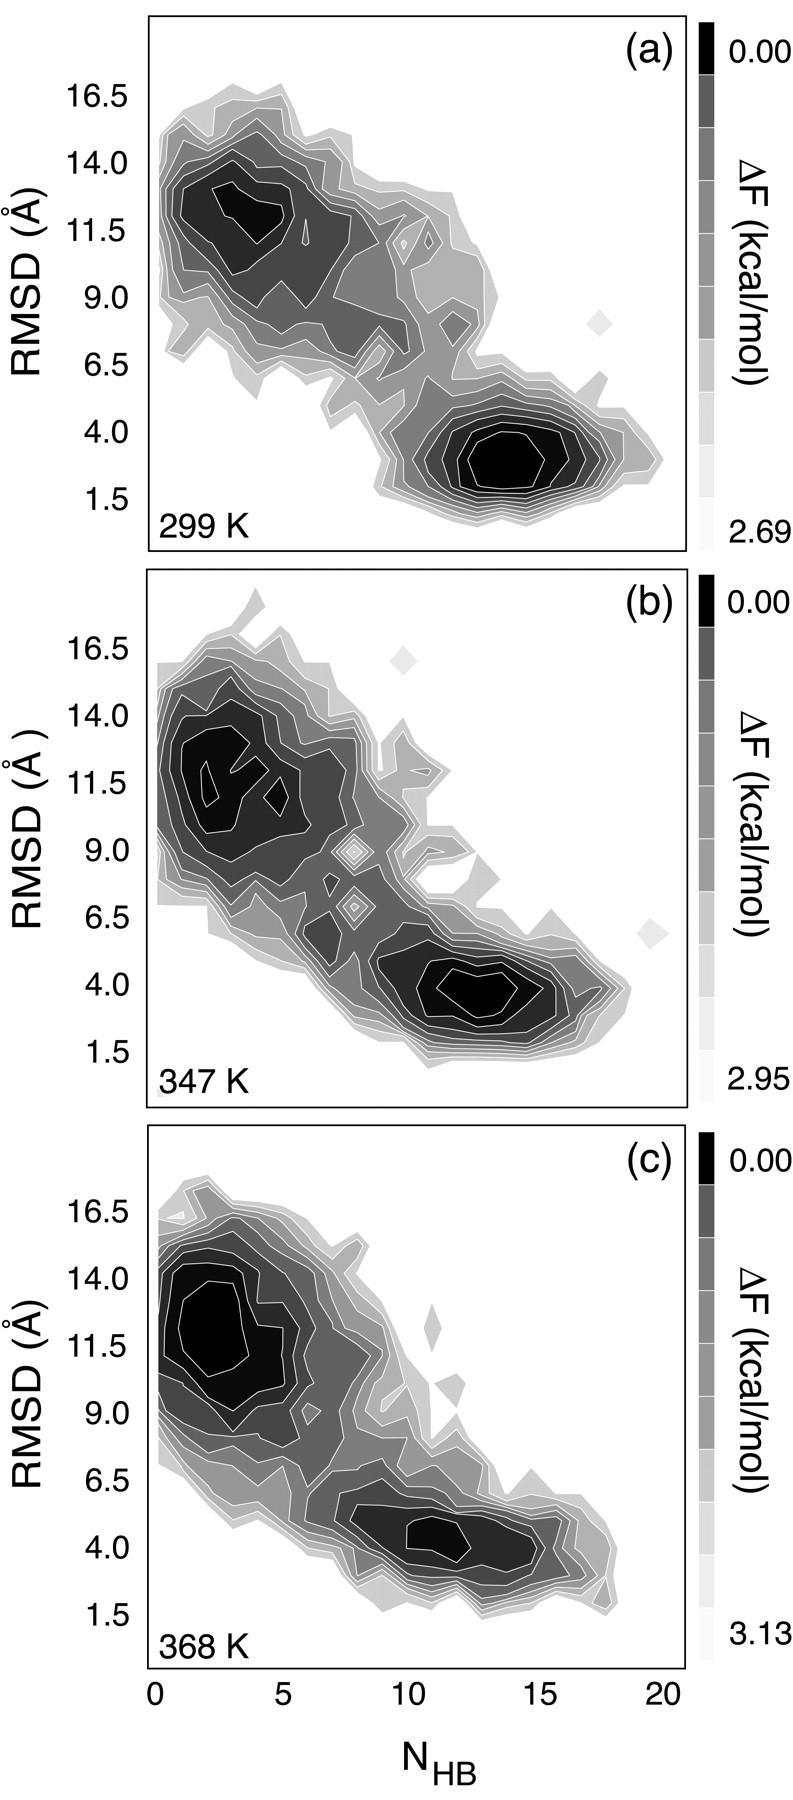
MREMD-derived approximate statistical energy landscapes for RNA hairpin conformational dynamics are shown at (a) 299 K, near the temperature of the reported dynamic trajectories (300 K); (b) 347 K, near, but slightly above, the experimental melting temperature; and (c) 368 K, above the melting temperature. Energetic contours are scaled linearly between the two values shown at each temperature.