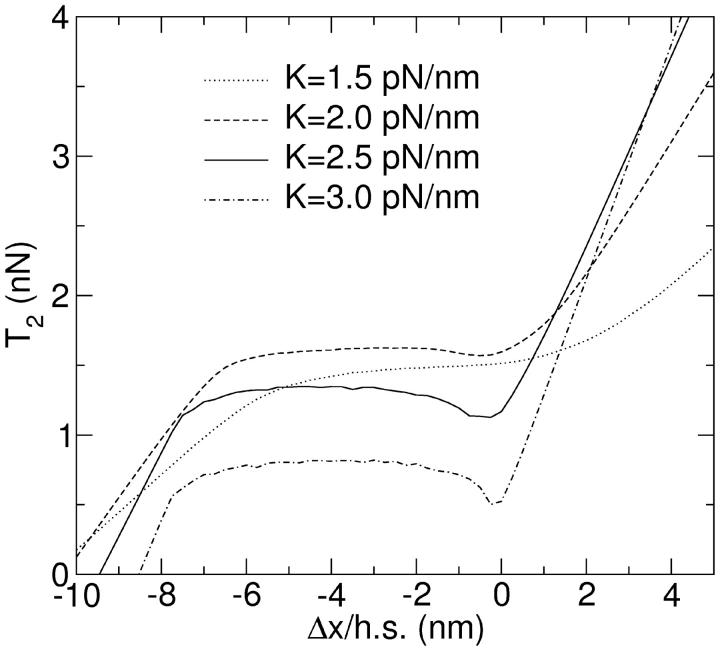
FIGURE 10.
T2 curves with filament redistribution. The simulations were performed with n = 16 filament pairs in series, each containing N = 300 myosin motors. Different curves show data for different values of the cross-bridge elasticity K, corresponding to values of ɛ1 between 0.8 and 1.6, and ɛ0 between 11.6 and 23.2.

