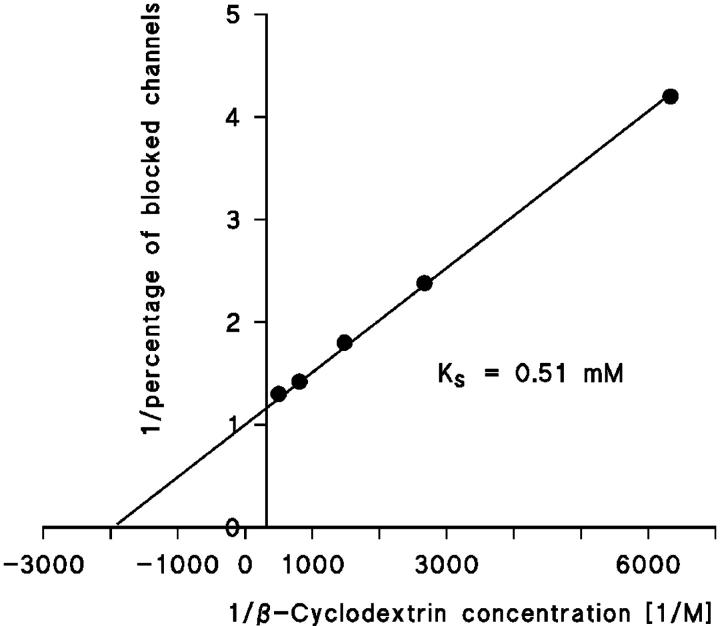
FIGURE 3.
Lineweaver-Burke plot of the inhibition of CymA-induced membrane conductance by β-cyclodextrin. The data were taken from Fig. 2 and were analyzed using Eq. 5. The straight line corresponds to a stability constant, K, for β-cyclodextrin binding of 1960 1/M. For further explanations, see text.

