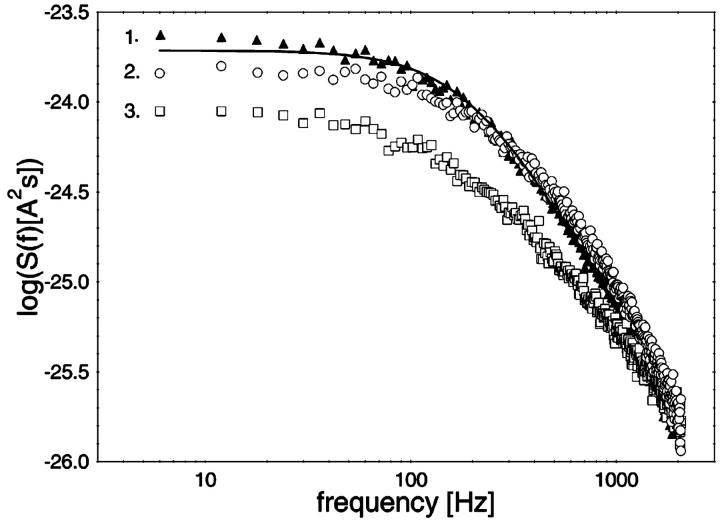
FIGURE 7.
Power density spectra of a membrane containing ∼250 CymA-channels after addition of different concentrations of α-CD. The membrane was formed from diphytanoyl phosphatidylcholine/n-decane. The upper trace (trace 1) shows a Lorentzian, taken in the absence of α-CD (τ = 0.84 ms; S0 = 1.9 × 10⁻²⁴ A2s). Trace 2 and trace 3 show the power density spectra in the presence of 10 and 630 μM of α-CD, respectively, added to both sides of the membrane. The aqueous phase contained 1 M KCl (pH 6). T = 20°C; Vm = 20 mV.

