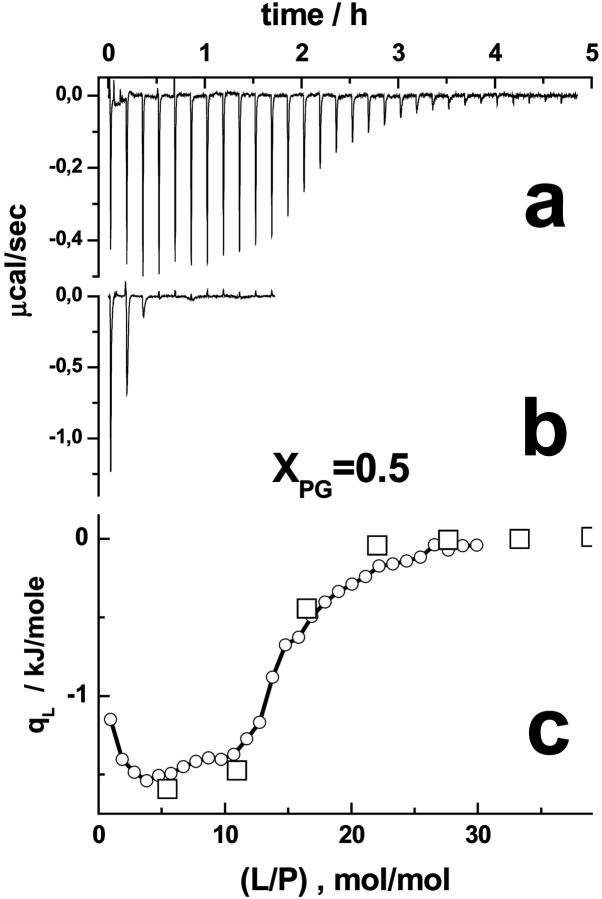
FIGURE 3.
Lipid-to-peptide titration experiment of lipid SUV (XPG = 0.5) to penetratin. The calorimeter traces in the a and b were obtained with Lsyr = 3 mM/P0 = 0.025 mM, and Lsyr = 15 mM/P0 = 0.0125 mM, respectively. Because of the smaller lipid concentration in the syringe, 6–7 times more injections, and a longer time span are necessary in the former experiment to adjust a certain lipid-to-peptide molar ratio, (L/P), in the calorimeter cell. Panel c shows the differential heat of reaction as a function of (L/P). The circles and squares refer to the traces shown in a and b.

