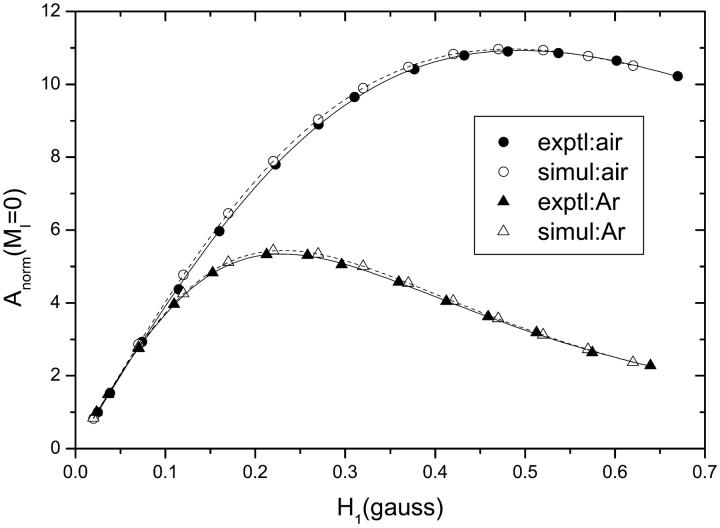
FIGURE 4.
Dependence on microwave field intensity, H1, of the central (MI = 0) amplitude in the first-harmonic in-phase V1-EPR spectra of 8-PCSL in fluid DMPC membranes (T = 39°C) that are saturated either with air (circles) or with argon (triangles). Solid symbols are experimental data points. Open symbols are saturation curves obtained from the central amplitudes of V1-EPR spectra simulated with fixed T1 for increasing H1. Solid and dashed lines are fits of Eq. 1 to the experimental and simulated curves, respectively.

