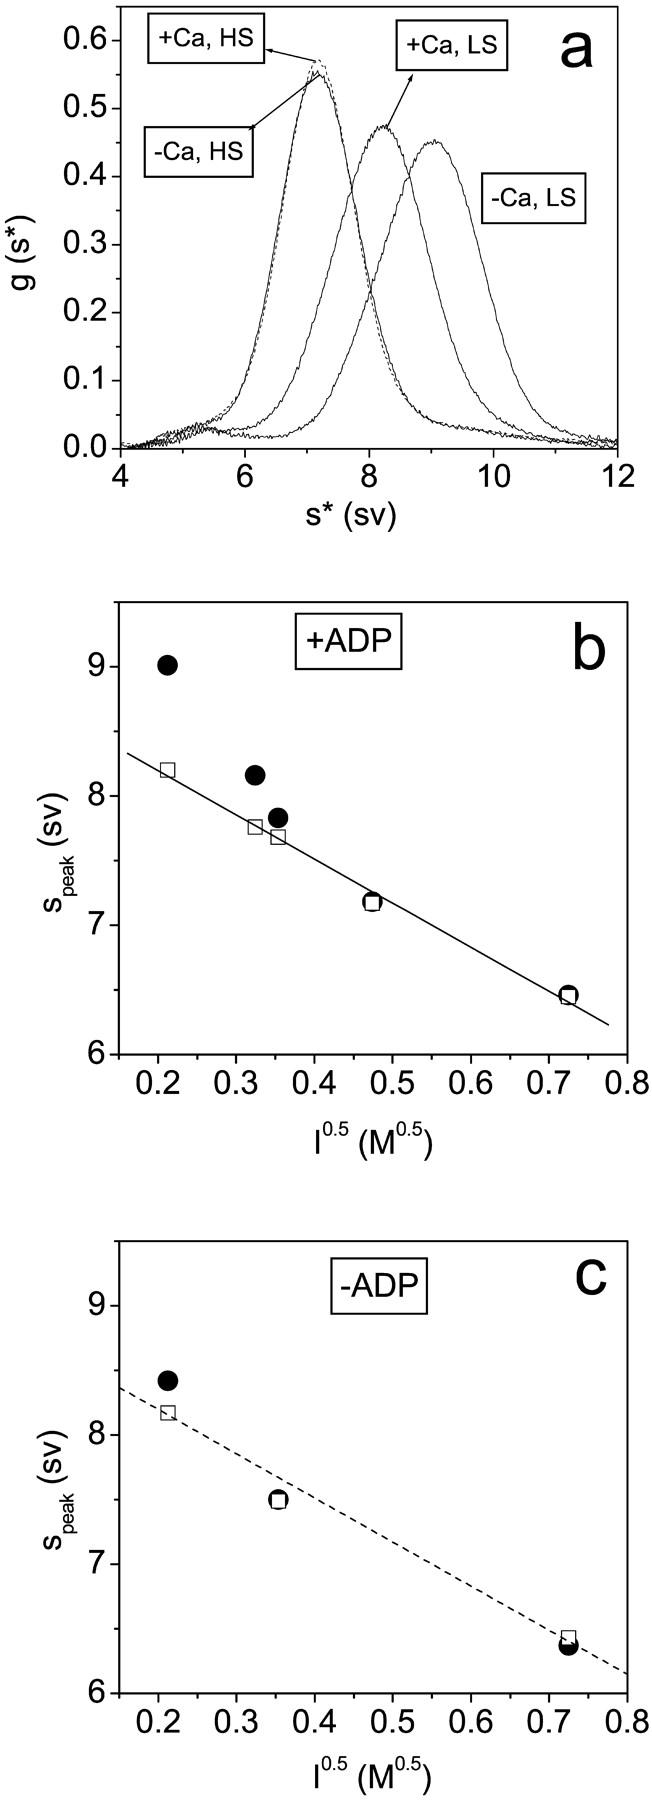
FIGURE 4.

The ionic strength dependence of the sedimentation of scHMM. (a) Sedimentation results in the presence of 100 μM ADP with and without 100 μM calcium (as indicated) at 20 mM NaCl (LS) and at 200 mM NaCl (HS). (b) The dependence of sedimentation on √(ionic strength) in 100 μM ADP with a best fit line drawn through the data in the presence of calcium. (c) Data in the absence of nucleotides with the line reproduced from b to aid comparison. The peak positions are shown in the presence (empty squares) and absence (filled circles) of calcium (100 μM). Protein concentrations were typically in the range 0.1–1.0 mg/ml. No concentration dependence of the sedimentation patterns was seen, indicating the absence of any reversible aggregation.
