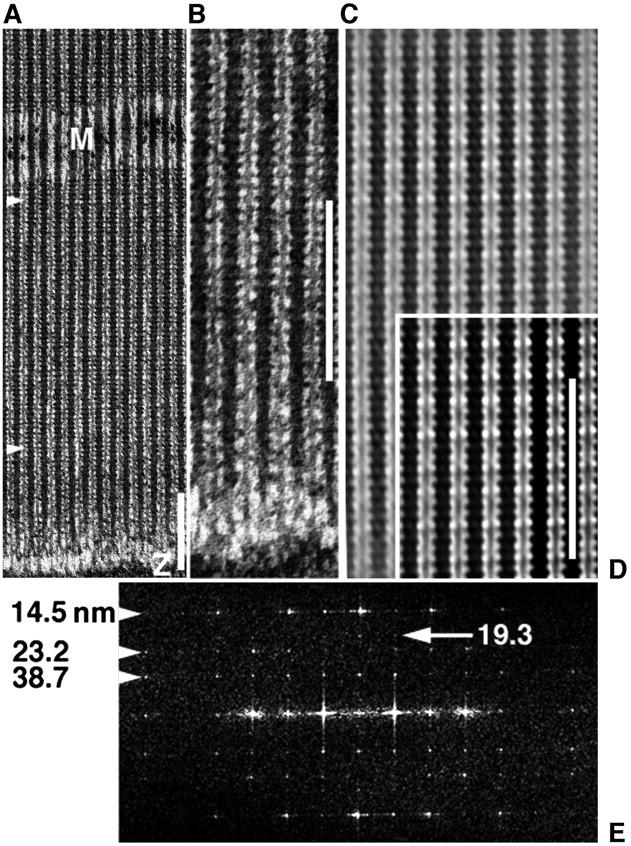
FIGURE 1.

EM images and analysis of a myac layer (myosin and actin alternate where a 25 nm section includes single filament layer) from glycerinated, unstretched, Lethocerus IFM, plunge-frozen to −190°C in the relaxed state (5 mM Mg-ATP), then freeze-substituted in acetone at −80°C via TAURAC fixation. Scale bars = 232 nm. (a) EM shows ∼70% of length of a typical 2.67 μm sarcomere. Thick filaments keep a tight lateral register across the A-band of axial 14.5-nm cross-bridge repeat, despite a loose whole-filament register (meander of Z- and M-bands). (b) The same preparation as a but a different region showing clear C-filament connections to the Z-band. (c and d) The filtered image brings out a long 116-nm repeat as “beating” of a 14.5-nm myosin repeat against two 38.7-nm pseudorepeats of actin, one intrinsic to thick filaments, the other to thin filaments. In d, 38.7 nm appears as denser cross-bridge contacts with dense segments (troponin) along thin filaments, in contrast to rigor and active contraction where cross-bridges between troponins are predominant (Taylor et al., 1999). (e) The computed image transform from the A-band region between arrowheads in a shows that cryofixation has preserved native ordering of layer-line relative intensities (14.5 > 38.7 > 23.2 > 19.3 nm; see native x-ray pattern of Fig. 2 a). By contrast, direct chemical fixation suppresses 23.2 nm and enhances 19.3 nm (giving 14.5 > 38.7 > 19.3 ≫ 23.2 nm) (Reedy et al., 1983, 1987). Scale bars in a, b, and d all show ∼16 repeats of the 14.5-nm repeat of myosin head crowns.
