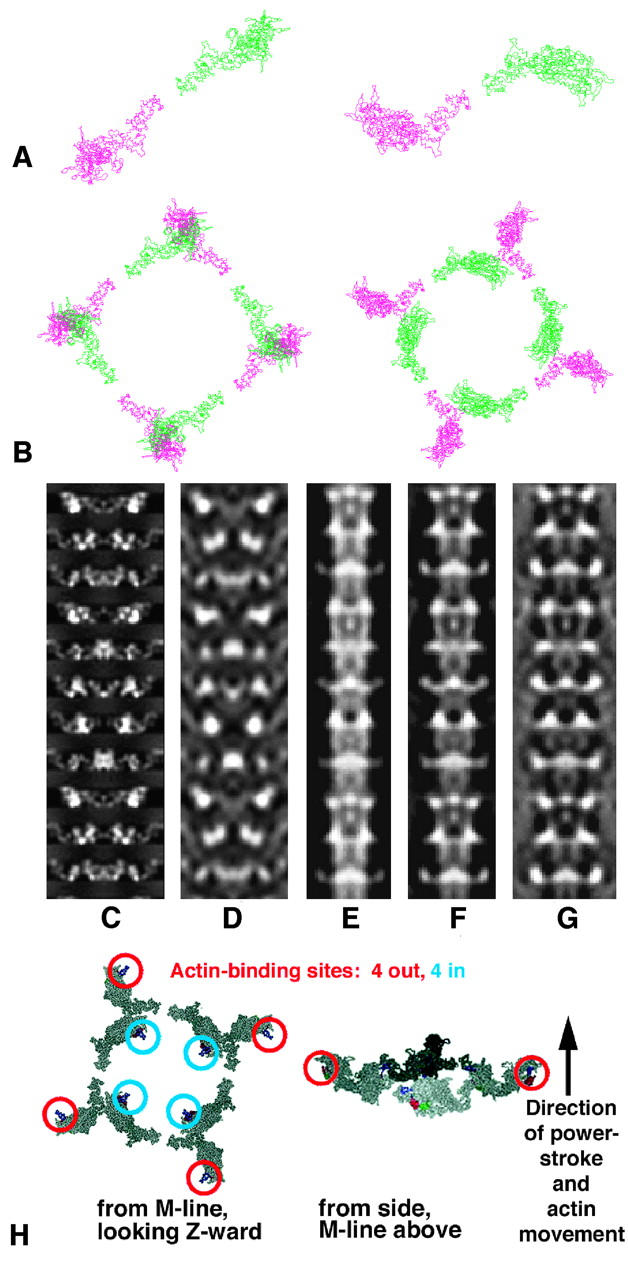
FIGURE 6.

(a and b) The lowest R-factor structures using a Rayment head (left; R-factor 22.2%) and the new modeled head (right; R-factor 9.7%), both viewed looking down the filament axis toward the Z-band. In each case, a shows the relationship between the two heads of one myosin molecule and b shows one full crown of eight heads. Note that the Rayment structure (left) has sterically clashing heads. (c–g) Comparison of x-ray and electron microscopy models (Morris et al., 1991). c, d are projections of the best model of this study at 20 Å and 60 Å resolution, respectively, and e–g are projections of the IFM thick filament 3D reconstruction of Morris et al. (1991) based on analysis of electron micrograph images of negatively-stained insect thick filaments with the 3D map recalculated with 100%, 50%, and 0% weighting for the equator. Among other things, reduced weighting of the equator reduces the contribution from the backbone, perhaps making the EM model more comparable to the x-ray model. Comparison of c, d, and e–g suggests that the polarity of the x-ray model is such that the M-band is at the top, as it is known to be in the electron micrograph reconstructions. (h) Two views of a single myosin head crown in the best model showing the actin-binding sites on the myosin heads. As in a and b, the left image is a view looking Z-ward from the M-band and the right shows a side view with the actin filament axis nearly vertical, with the M-band at the top, Z-band at bottom.
