
FIGURE 7.
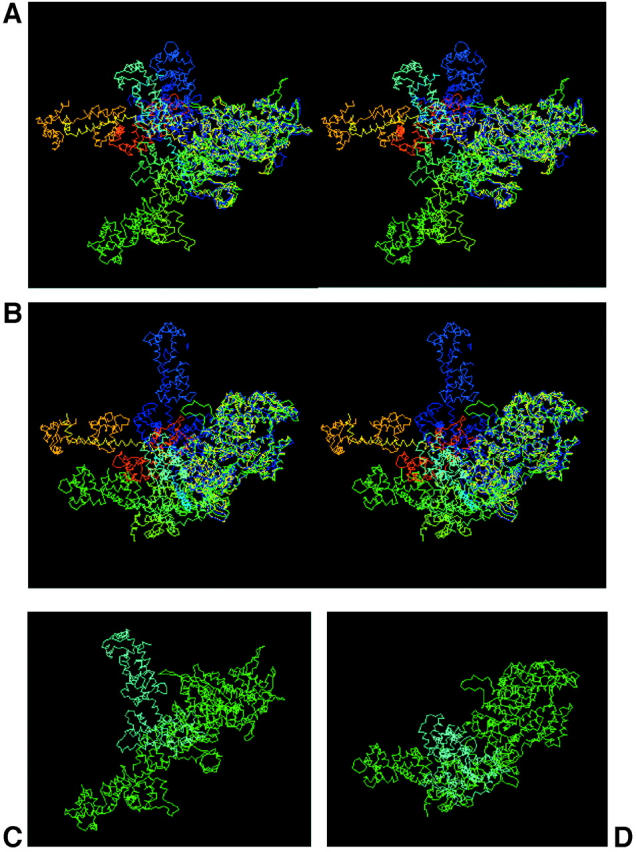
Comparing S1 from our model with published crystal structures. All are superimposed at the catalytic domain, so that the differences between models are expressed by the different positions of the neck region or lever-arm. (a and b) Stereo views. Green and pointing slightly toward the viewer is the Rayment et al. (1993a,b) chicken skeletal myosin with no nucleotide (i.e., rigor-like); dark blue is the Dominguez et al. (1998) chicken smooth muscle myosin in ADP•AlF4 form; pale blue is our Lethocerus model; orange is the Houdusse et al. (2000) scallop myosin in Mg•ADP•VO4 form. The view in a has the actin filament axis vertical and to the right, with the M-band at the top and Z-band at the bottom, whereas b is the view down the actin filament axis toward the Z-band (behind the page). (c and d) Direct comparison of the relaxed Lethocerus head shape with the Rayment et al. (1993a) structure. Green is the Rayment rigor structure and pale blue shows our Lethocerus model superimposed on the Rayment structure (Z-band is at the bottom in c and behind the page in d).