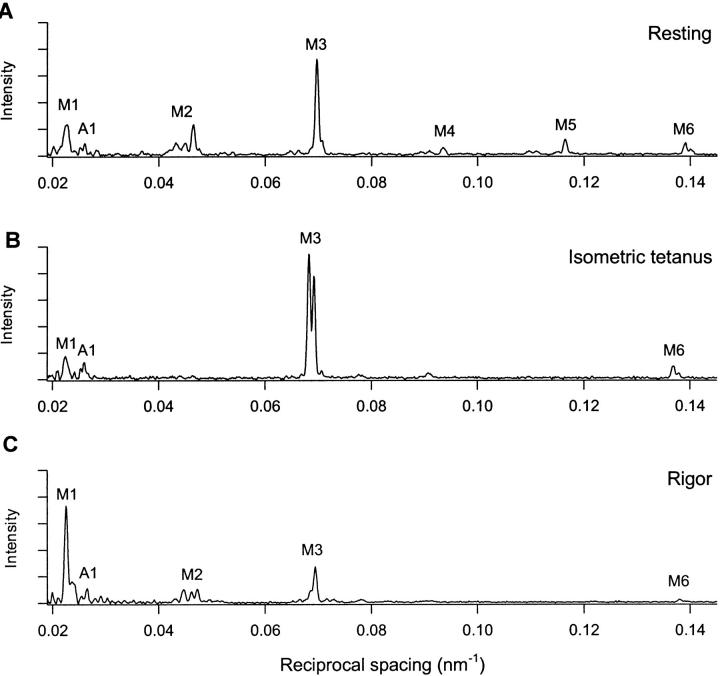
FIGURE 3.
Axial x-ray intensity distributions: A, at rest; B, isometric tetanus plateau; and C, low-force rigor. Intensity data from the fiber in Fig. 2, integrated from 0.013 nm−1 on either side of the meridional axis and normalized by exposure time in each condition. M1, M2, M3, M4, M5, and M6 indicate the myosin-based axial reflections. A1 indicates the actin-based axial reflection at 38.4 nm.

