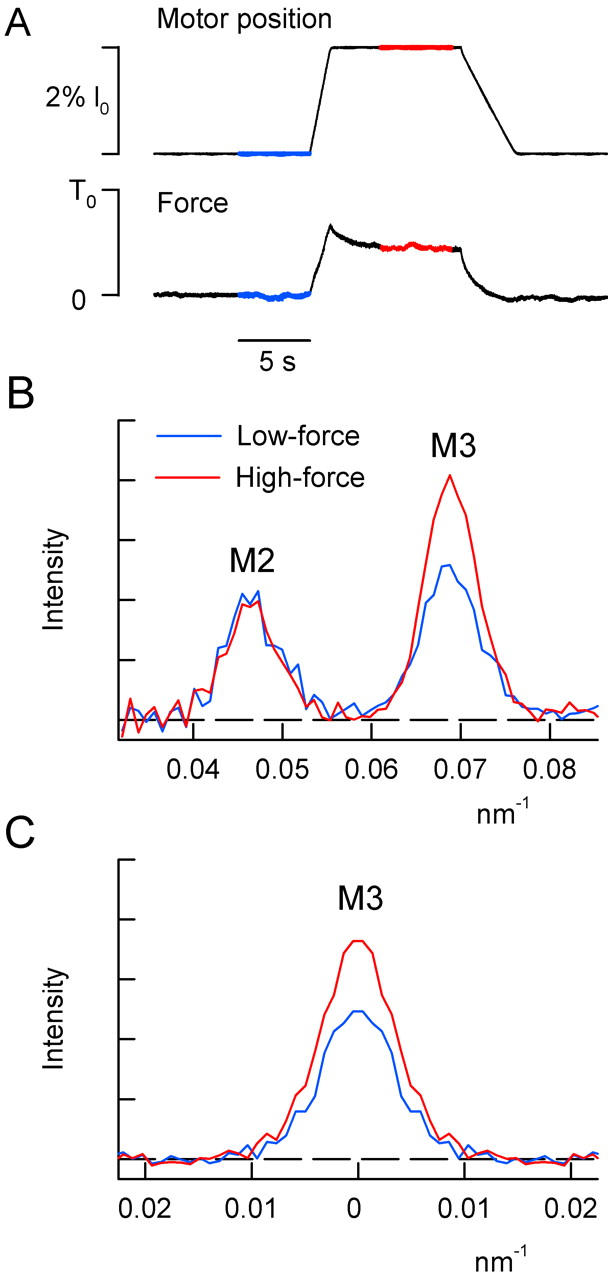
FIGURE 4.

Effect of stretch on the M2 and M3 x-ray reflections in rigor; Daresbury Synchrotron. (A) Length and force records from one fiber. Blue and red segments indicate the periods when the shutter opened to collect the low-force and high-force x-ray data, respectively. (B) Axial intensity distribution at low-force (blue) and high-force (red) from three fibers. (C) Radial intensity distribution in the region of the M3 reflection (axial integration limits 0.061–0.077 nm−1).
