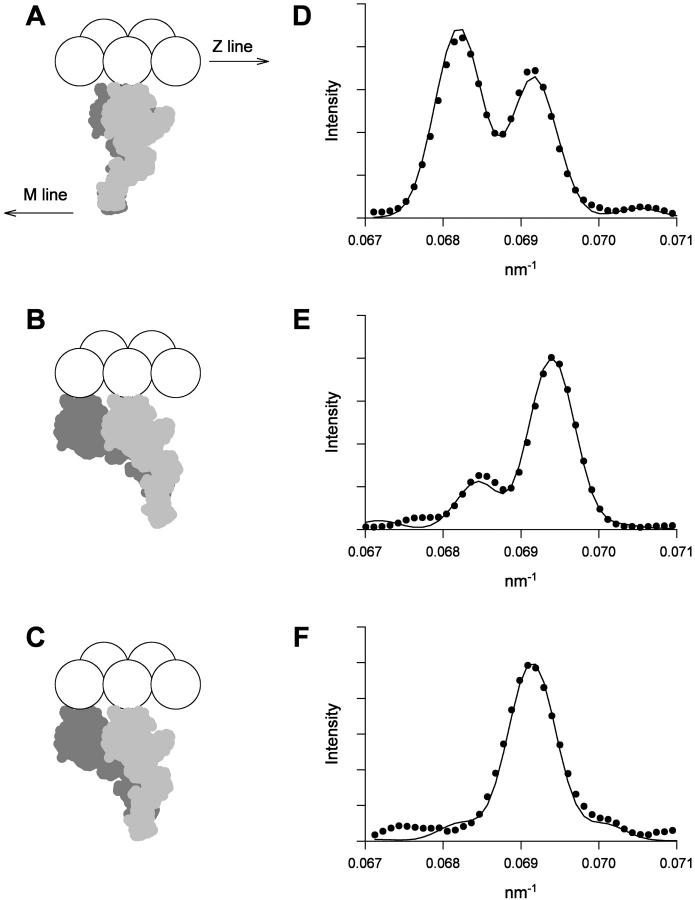
FIGURE 7.
M3 intensity profiles calculated from the two-head model. (A and D) Isometric contraction. (B and E) Low-force rigor. (C and F). High-force rigor. In A–C, the two heads of one myosin molecule are shown in light and dark gray; actin monomers are shown as white spheres. In D–F, the experimental intensity profiles are shown as black circles and the profiles calculated from the two-head model convolved with the point-spread function of the x-ray beam and detector are shown as continuous lines.

