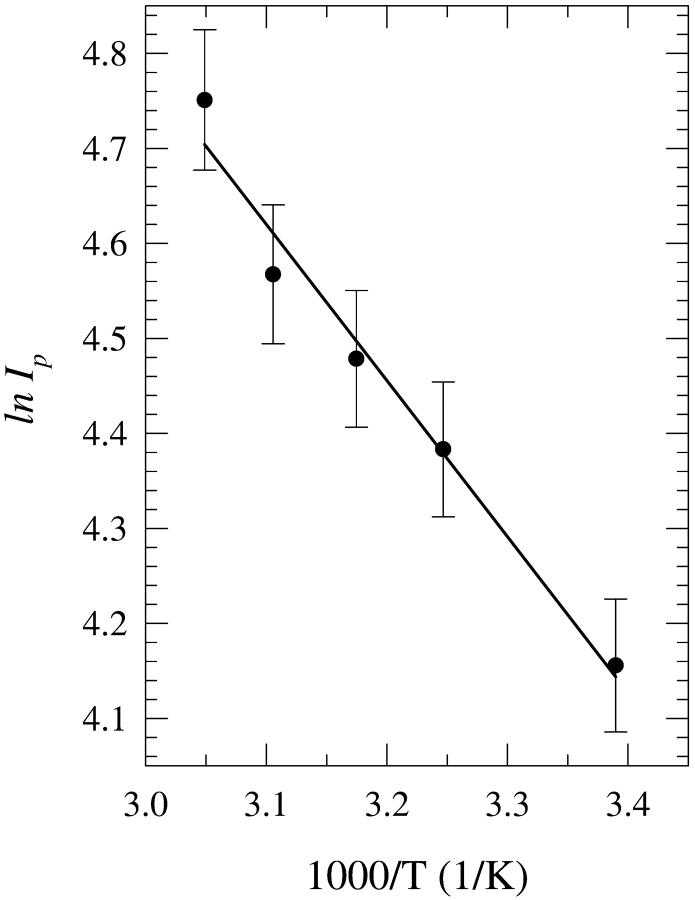
FIGURE 13.
Plot of the natural logarithm of the fluorescence peak intensity Ip of the spectra of 2′-deoxyadenosine (dA) in 8% (v/v) “carry its own water” solutions in acetonitrile as a function of 1/T, where T is the absolute incubation temperature. The solutions were heated for 20 min and were then allowed to cool to room temperature before the fluorescence spectra were measured. The error bars indicate the standard deviation.

