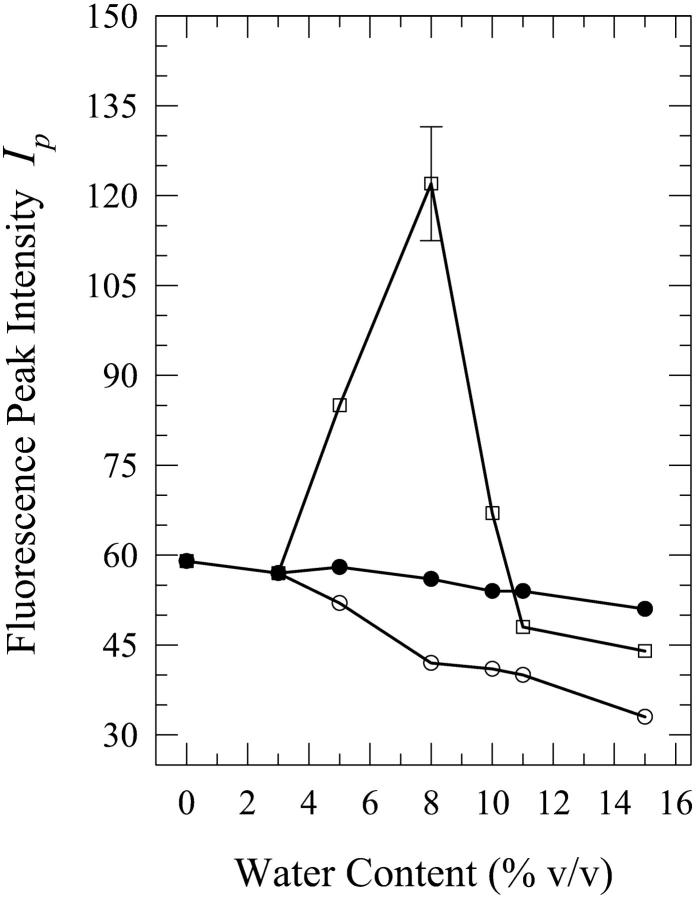
FIGURE 6.
Plot of the fluorescence peak intensity Ip for “premixed” (open squares), “carry its own water” (open circles), and “injected water” (filled circles) solutions of 2′-deoxyguanosine (dG) in n-butanol aqueous mixtures as a function of the water content (% v/v). The lines do not represent fits to the data; they have been drawn to guide the eye. The error bars indicate the largest standard deviation for these data.

