
FIGURE 6.
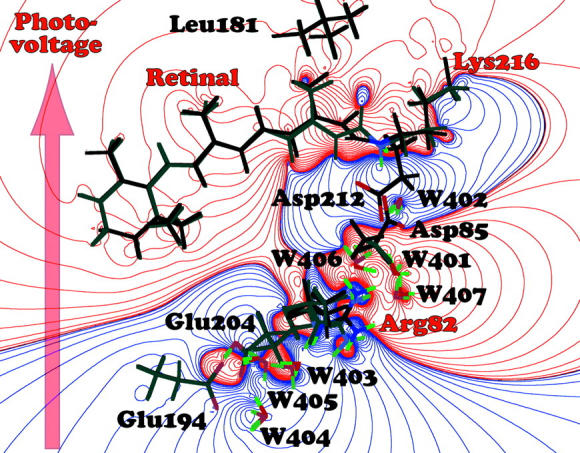
Electrostatic difference map associated with the formation of the K state. The dark bonds indicate K state residues and the lighter gray bonds indicate BR residues, and some residues do not move enough to be visible in this figure. The arrow indicates the net shift in positive charge, and by convention, the resulting photovoltage is assigned to be negative because it is in the opposite direction as the proton pumping direction (Fig. 1). The major contributors to the charge shift are labeled with red letters. The crystallographic data are from protein data bank entry 1M0P (Schobert et al., 2002).