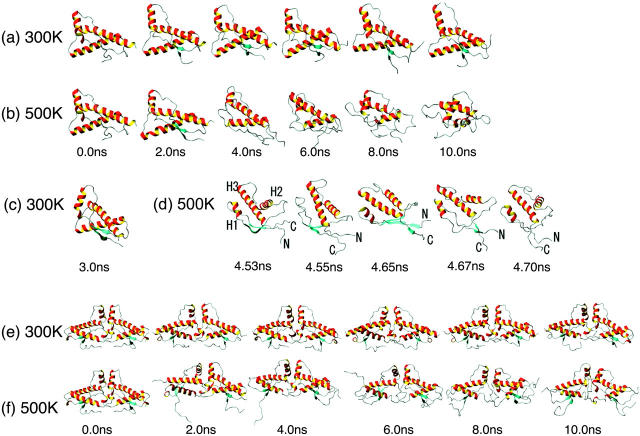
FIGURE 5.
(a) Temporal history of the monomer at 300 K; (b) temporal history of the monomer at 500 K; (c) one snapshot of the monomer at 300 K; (d) details of temporal history of the monomer at 500 K around 4.6 ns; (e) temporal history of the dimer at 300 K; and (f) temporal history of the dimer at 500 K.

