
FIGURE 7.
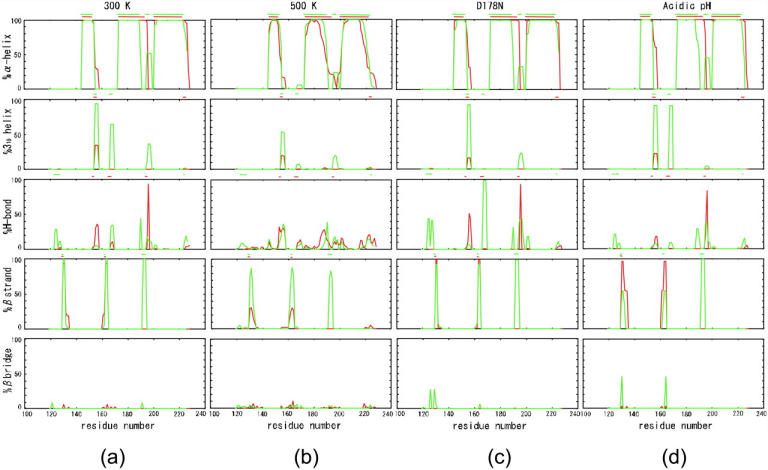
Percentage of secondary structure per residue during simulations at (a) 300 K, (b) 500 K, (c) D178N, and (d) acidic pH. Red and green indicate the monomer and dimer, respectively. Lines above each figure show the initial structure.
Official websites use .gov
A
.gov website belongs to an official
government organization in the United States.
Secure .gov websites use HTTPS
A lock (
) or https:// means you've safely
connected to the .gov website. Share sensitive
information only on official, secure websites.
Percentage of secondary structure per residue during simulations at (a) 300 K, (b) 500 K, (c) D178N, and (d) acidic pH. Red and green indicate the monomer and dimer, respectively. Lines above each figure show the initial structure.