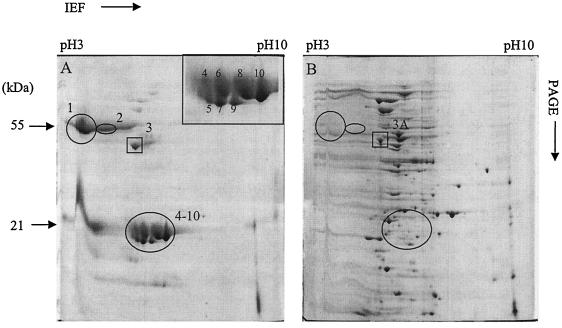
FIG. 2.
ECP profiles of E. tarda PPD130/91 (virulent) (A) and PPD125/87 (avirulent) (B) on a Coomassie blue-stained 2D gel with a broad range of pHs (3 to 10). Ten major protein spots (circled spots indicate proteins unique to the virulent strain; boxed spots [including spot 3A] indicate proteins common to both strains) were selected for MS analysis. The inset in panel A is an enlarged image of protein spots 4 to 10, and the number of each spot is as shown.

