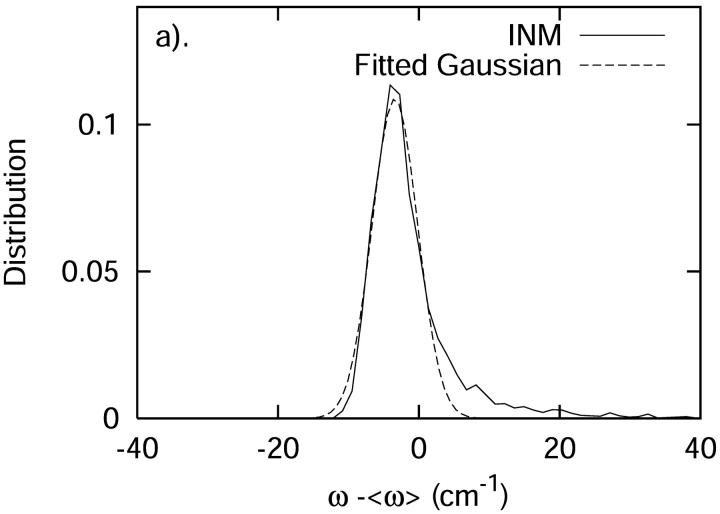
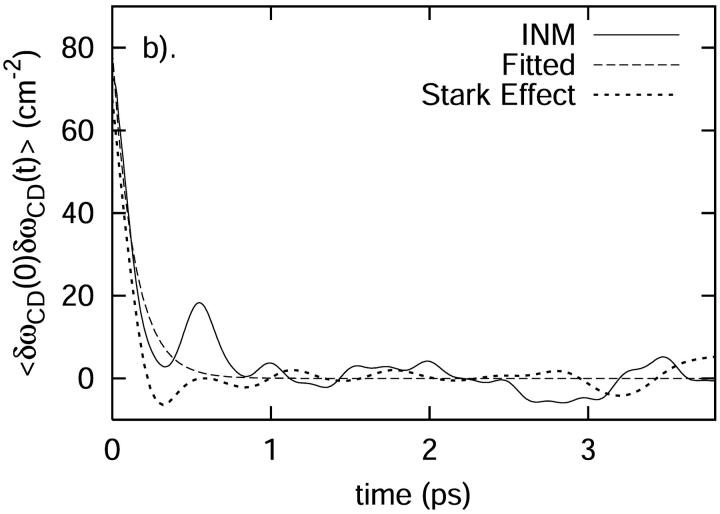
FIGURE 12.
(a) The distribution of the fluctuating frequency δωCD plotted against the fit to a Gaussian function of frequency. (b) The fluctuating frequency autocorrelation function plotted against the fit to an exponential function of time. Plotted for comparison is the prediction based solely on the modulation in the C-D frequency through a Stark effect.


