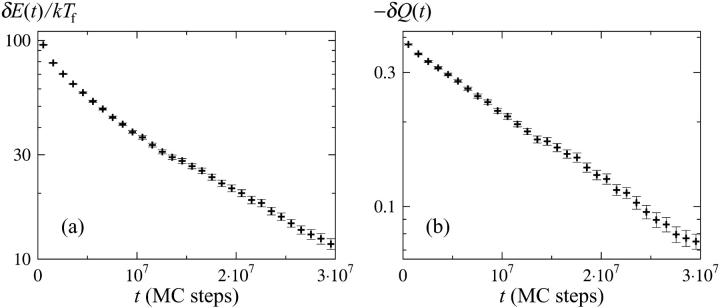
FIGURE 4.
Relaxation behavior of the three-helix-bundle protein at the folding temperature Tf, starting from the equilibrium ensemble at T0 ≈ 1.06Tf. (a) δE(t) = E(t) − 〈E〉 against simulation time t, where E(t) is the average E after t MC steps (3000 runs) and 〈E〉 denotes the equilibrium average (at Tf). (b) Same plot for the nativeness Q.

