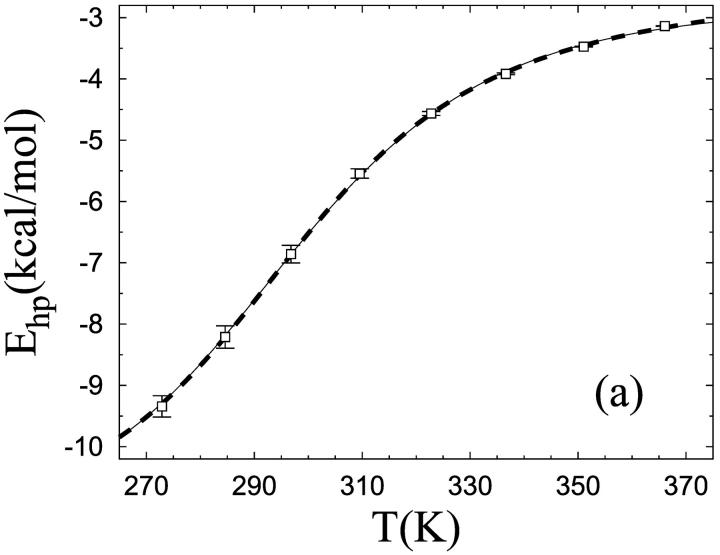
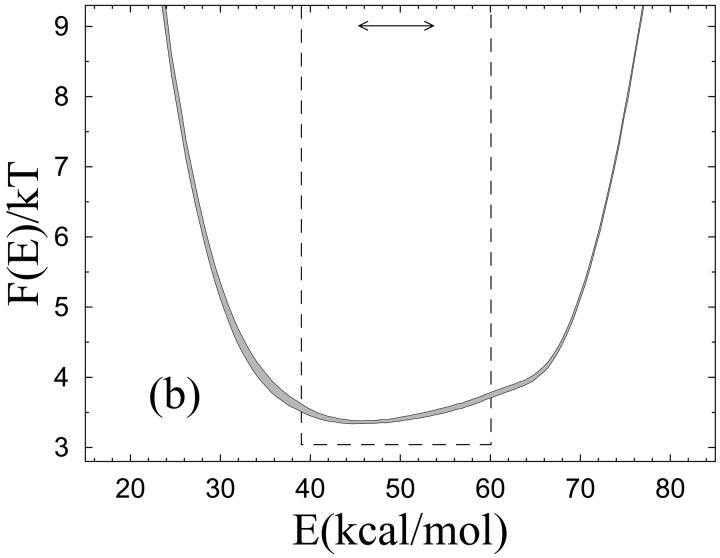
FIGURE 2.
Unfolding of the β-hairpin sequence. (a) Temperature dependence of the hydrophobicity energy Ehp (see Eq. 6). The solid and dashed curves (essentially coinciding) are fits of the data to the two-state expression  and the square-well model (see text), respectively. The effective equilibrium constant K is assumed to have the first-order form K = exp[(1/kT − 1/kTm)ΔE]. Both fits have three free parameters, whereas Tm = 297 K is held fixed. (b) Free-energy profile F(E) = −kT ln P(E) at T = Tm, obtained by reweighting (Ferrenberg and Swendsen, 1988) the data at a simulated T close to Tm. The shaded band is centered around the expected value and shows statistical 1σ errors. The double-headed arrow indicates ΔE of the two-state fit. The dashed line shows F(E) for the square-well fit.


