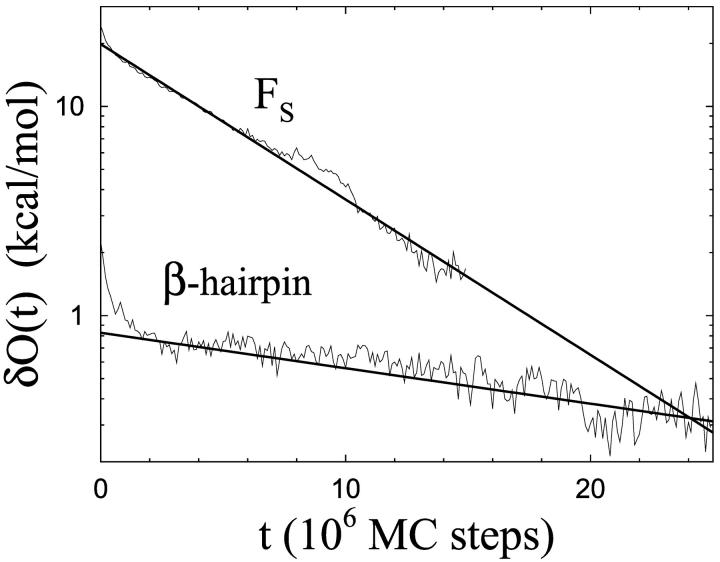
FIGURE 4.
Monte Carlo relaxation of ensemble averages at T = Tm for the β-hairpin and the Fs peptide. The deviation δO(t) from the equilibrium average (see text) is plotted against the number of elementary Monte Carlo steps, t. Straight lines are χ2 fits of the data to a single exponential. Data for t > 15 × 106 are omitted for Fs due to large statistical errors.

