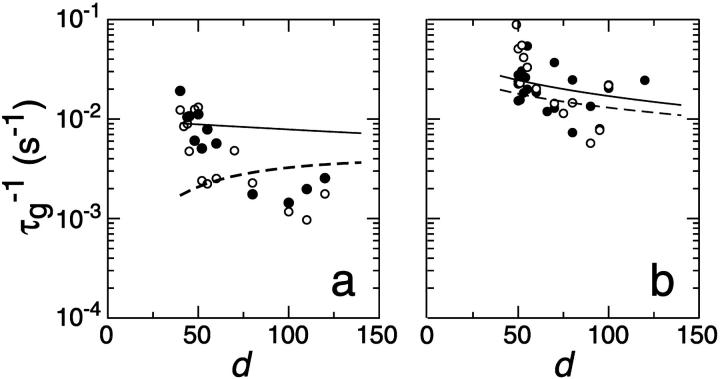
FIGURE 5.
Rate  obtained from the normalized initial slopes of the scattered intensity (•) and diffusion coefficient (○) as a function of final dilution d for different salt concentrations cs (a: 130 mM, b: 230 mM). Model predictions are shown as lines with electrostatic interactions based on constant potential (solid line) and constant charge (dashed line), respectively. Parameters for calculations: aD = 200 Å2, αm = 10 kT, and

