
FIGURE 1.
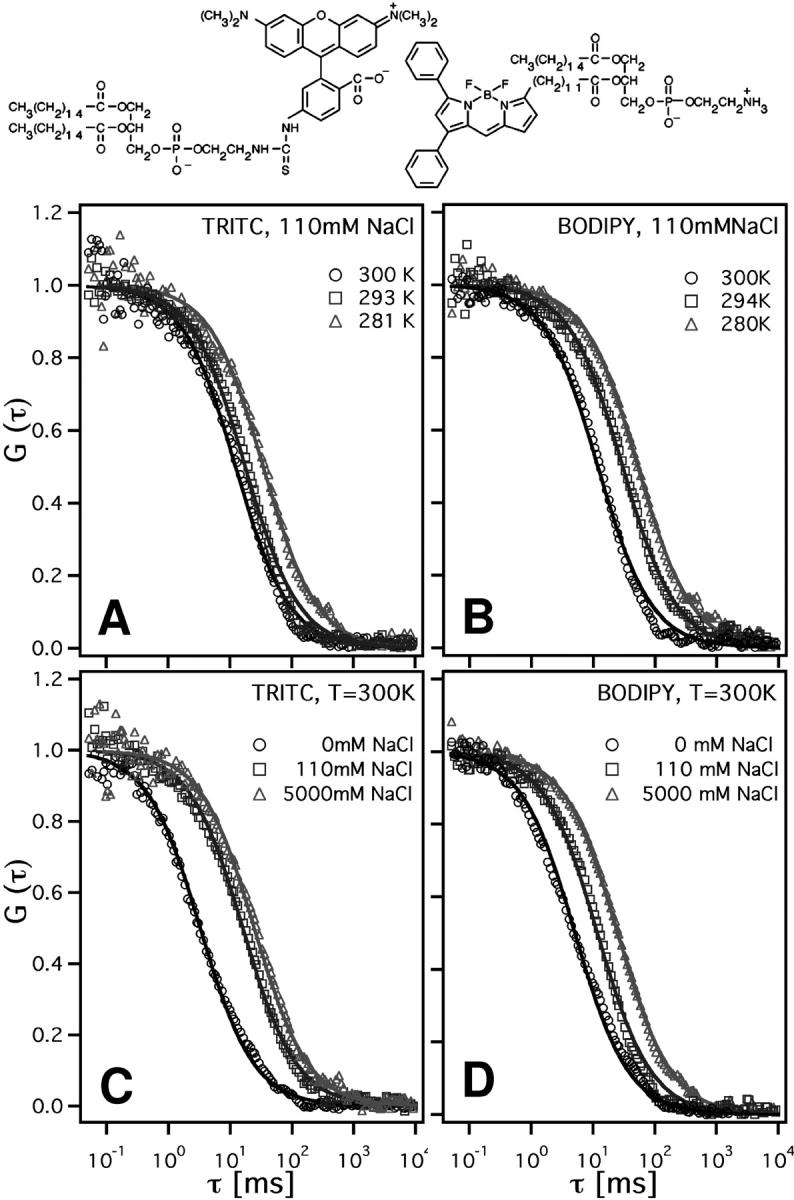
Normalized cross-correlation profiles, (1 + τ/τd)−1, of planar POPC bilayers, using fluorescence markers with labels in the headgroup region (TRITC-DHPE) and in the chain region (Bodipy-C12-HPE). Label structures are given in the top row. Cross correlations at three different temperatures using (A) TRITC-DHPE and (B) BODIPY-C12-HPE, and as a function of NaCl concentration, (C) TRITC-DHPE and (D) BODIPY-C12-HPE.