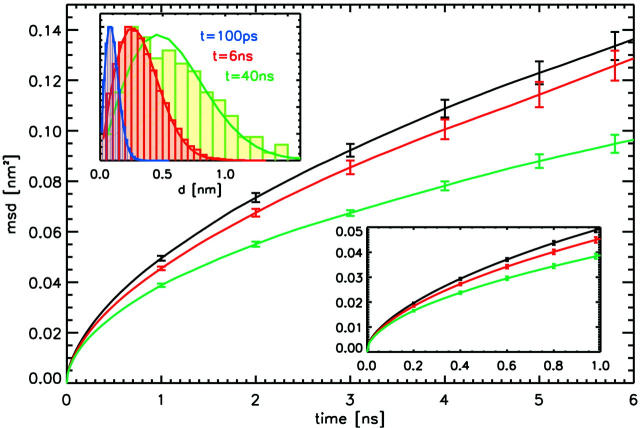
FIGURE 4.
Mean-square displacements of POPC lipids computed from the simulations. Shown are the results for the simulation without NaCl (black), at 50 mM NaCl concentration (red), and at 220 mM NaCl concentration (green curves), respectively. The lower inset shows the same data for 0–1 ns. The distribution of displacements for the simulation without ions, n(d), is given in the upper inset at three different times t. The solid lines display a fit to the solution of the two-dimensional diffusion equation, n(d) ∼ d exp(−d2/4Dt).

