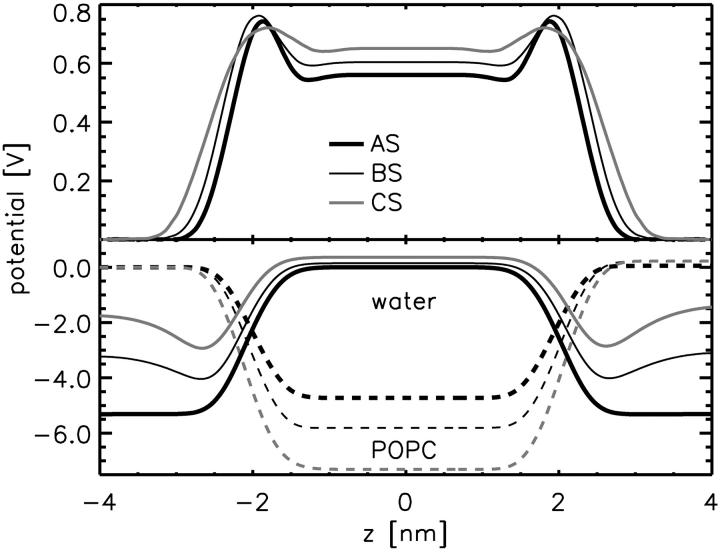
FIGURE 7.
(Upper panel) Total electrostatic potential (averaged and symmetrized) across the membrane (system AS, thick black line; BS, thin black line; and CS, gray line). (Lower panel) Contributions of water (dipole) potential (solid lines) and of POPC distribution (dashed lines) to the total electrostatic potential.

