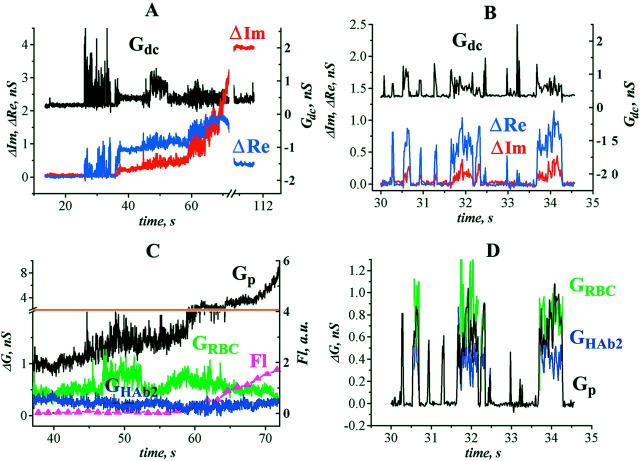
FIGURE 2.
Fusion between HAb2 cells and RBC at 33°C. (A) Time-course of admittance changes (ΔIm and ΔRe) and Gdc; zero time corresponds to the pH lowering. The first opening of the fusion pore occurred at ∼26 s. (B) Expanded segment of A illustrating fusion pore flickering. (C) Calculated conductances of fusion pore (Gp, left y-axis) and fusing membranes (GHAb2 and GRBC, left y-axis) after the pore stopped flickering (38–72 s from records shown in A). The increase in the integrated fluorescence of the HAb2 membrane (Fl, arbitrary units, right y-axis) corresponds to the transfer of lipid fluorescent dye PKH26 from the RBC membrane to the HAb2 membrane. (D) Calculated conductances of fusion pore (Gp, left y-axis) and fusing membranes (GHAb2 and GRBC, left y-axis) during the pore flickering (corresponds to records shown in B). Membrane conductances were calculated only on those parts of the record where the fusion pore was open (Eq. 1a).

