
FIGURE 4.
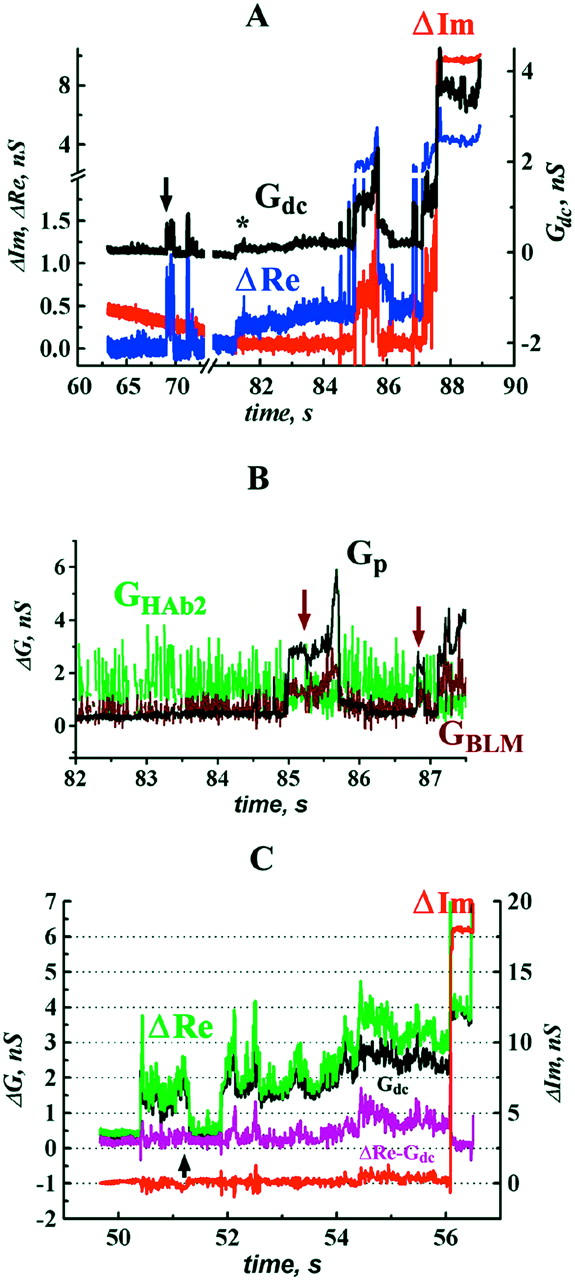
HA-induced changes in BLM conductance during HAb2/BLM fusion. (A) Time-course of admittance changes (ΔIm and ΔRe) and Gdc; zero time corresponds to the pH lowering. Arrow indicates the first opening of the fusion pore. Asterisk indicates change in Gdc without accompanying change in ΔIm. (B) Calculated conductances of fusion pore (Gp) and fusing membranes (GHAb2 and GBLM) after the pore stopped flickering (82–87.5 s from records shown in A). Arrows indicate transient changes in GBLM. (C) An example of a record in which change in Gdc was not accompanied by changes in ΔIm throughout the entire fusion process. Parameters for leakage estimates were sampled at the moment marked by arrow.