
FIGURE 5.
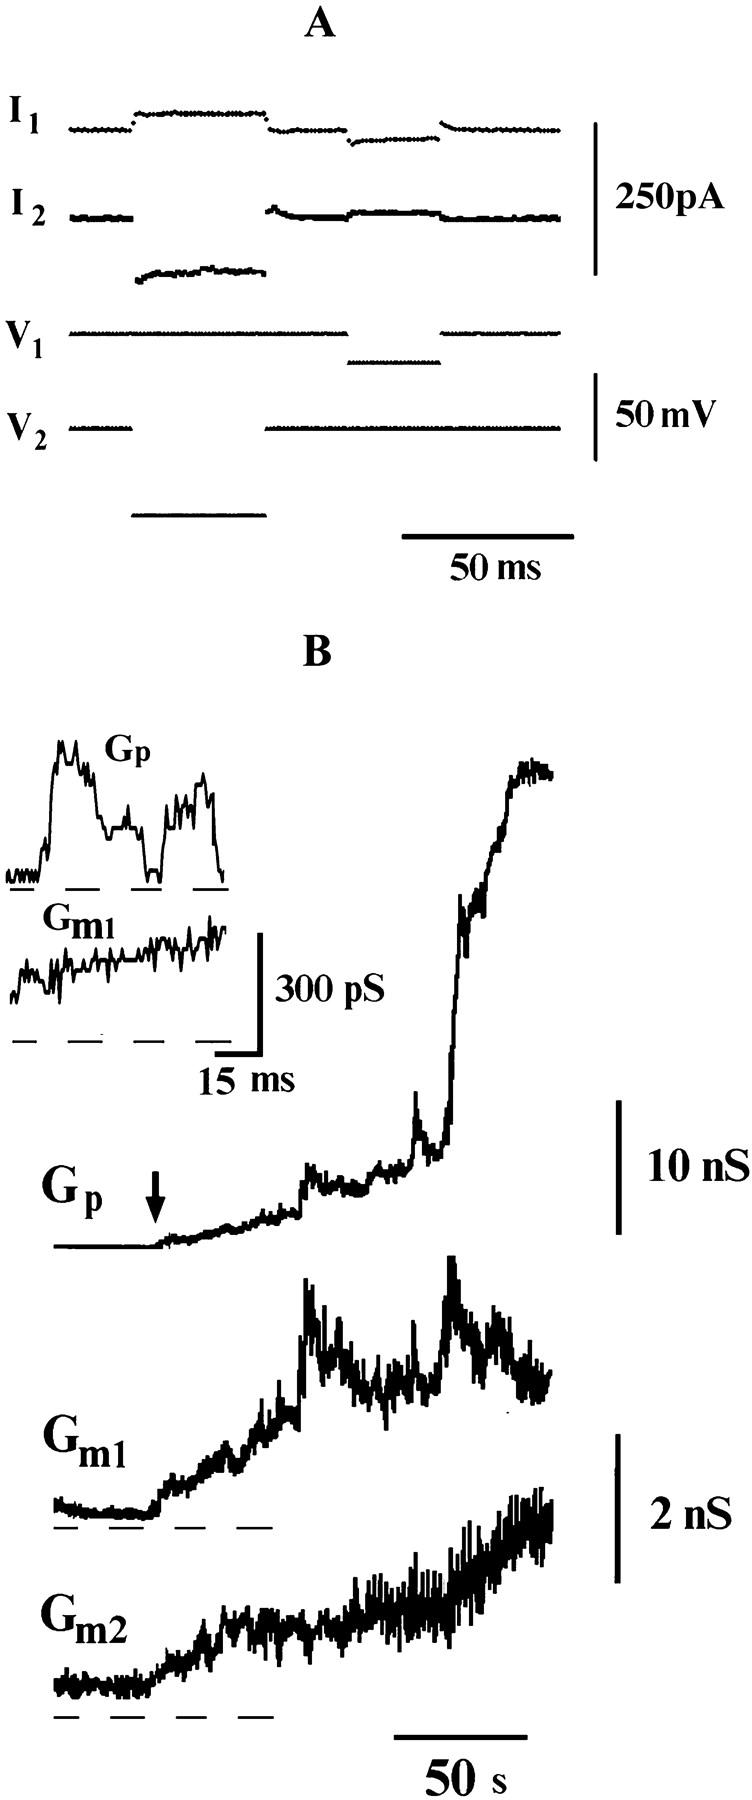
Fusion between HAb2 and PLC cells. (A) Traces illustrating the voltage-pulse protocol (see Materials and Methods). (B) Gm1 and Gm2 correspond to the DC conductance of fusing membranes, Gp to the intercellular conductance; the record begins 90 s after pH application. Insert shows the first opening of the fusion pore (the moment is marked by arrow).