
FIGURE 5.
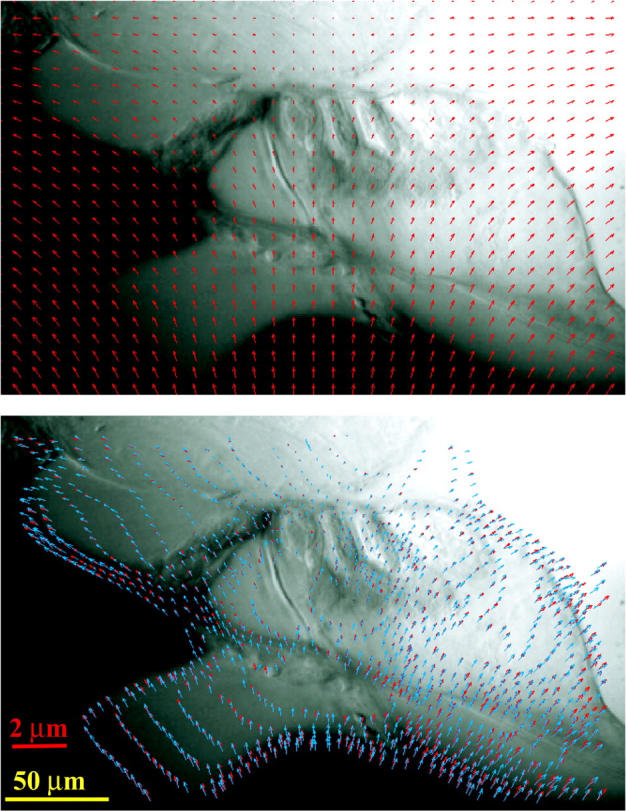
(top) Computer-generated motion field of a real image from the hemicochlear preparation. (bottom) Comparison of calculated optical flow field (blue arrows) with computer-generated artificial displacements (red arrows). The known motion fields are interpolated from rectangular grids to the mesh grids along the isointensity contours in the Lagrangian method, to generate a top-on-top plot. The yellow and red scale bars are for the image and the displacement arrows, respectively.