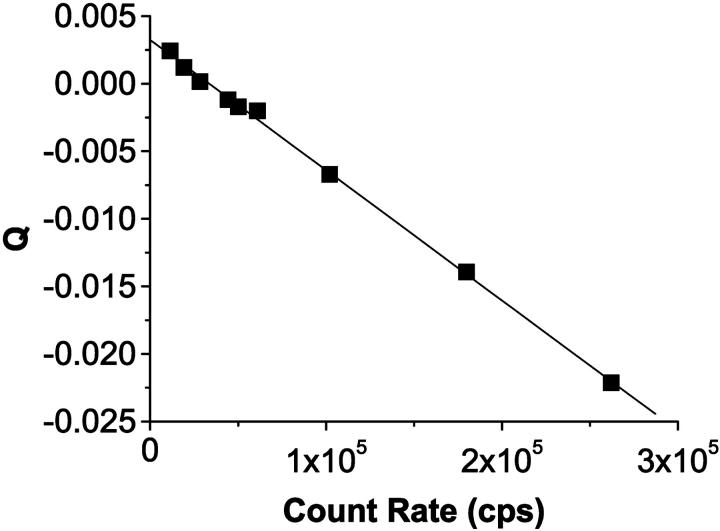
FIGURE 2.
A plot of Mandel's Q parameter for a constant light source, in this case a highly concentrated fluorescein sample, as a function of the photon count rate and a fit to Eq. 21. The slope is a measure of the dead-time of the system and the y-intercept is related to the afterpulse probability. The dead-time and afterpulse probability for our system were 48.2 ± 0.7 ns and 0.0016 ± 0.0001 ns, respectively.

