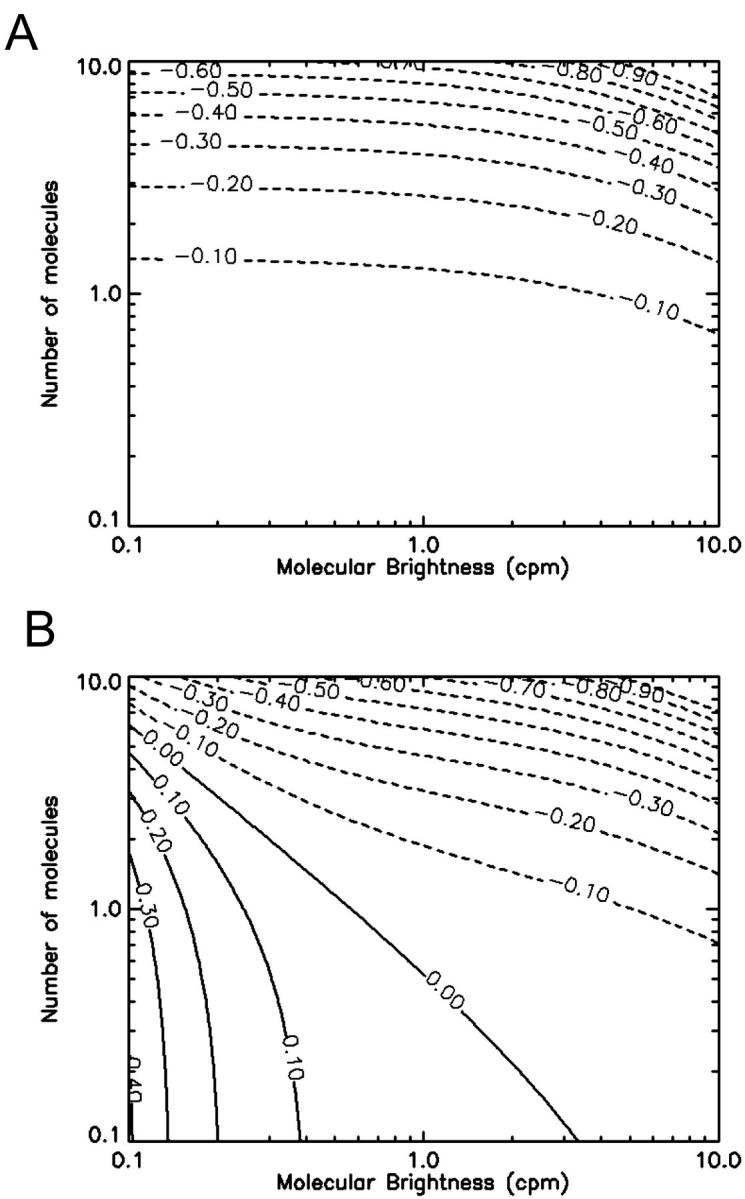
FIGURE 3.

Contour plots showing the relative error in the molecular brightness due to dead-time only (A) and both dead-time and afterpulses (B) as a function of ɛ and  . Dashed lines denote negative contours and solid lines denote positive contours. The contours were generated using a dead-time of 50 ns, sampling frequency of 50 kHz, and afterpulse probability of 0.0016. For low concentrations of
  little or no corrections are required for non-ideal detector effects as long as ɛ > 0.4 cpm. Dead-time introduces a relative error of greater than 10% when
  and must be corrected for. Afterpulses can safely be ignored for our system as their effects are restricted to low ɛ- and
  -values where we do not typically measure, due to poor signal statistics.
